12. Counterfactual Imputation
Causal Data Science for Business Analytics
Monday, 13. July 2026
Every number you reported filled a blank you never saw
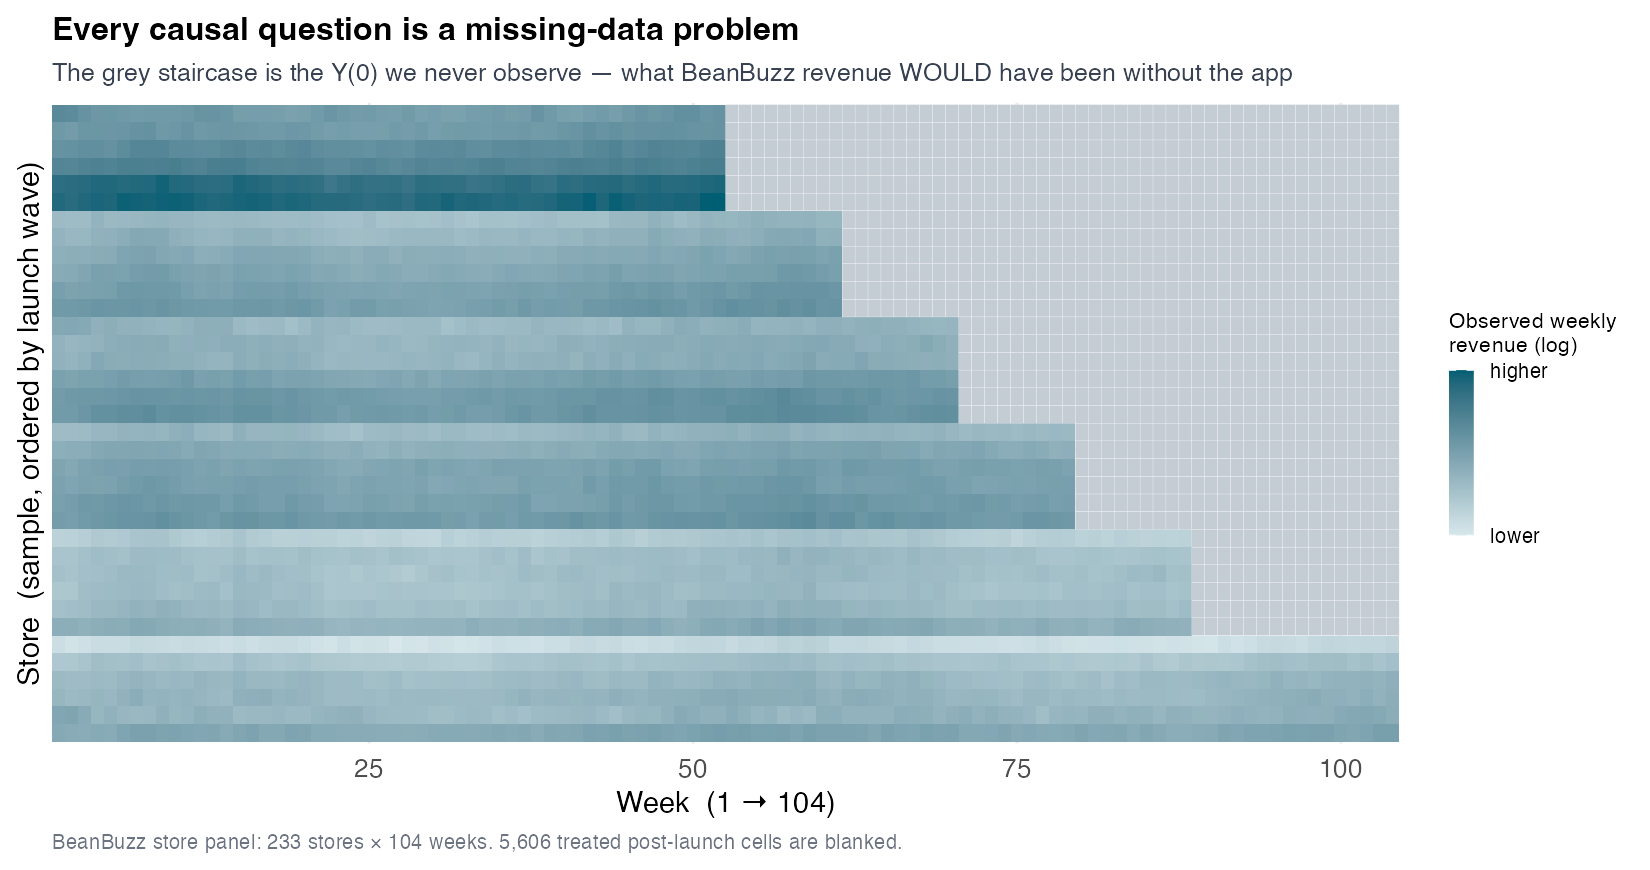
The BeanBuzz store panel: 233 stores × 104 weeks, balanced — 158 treated (staggered) + 75 never-treated.
The grey staircase is 5,606 treated cells. For each we need its untreated Y(0) — which by definition we never see.
Settle the design, and causation becomes prediction
A refrain from week one, half-right: correlation predicts; it does not identify a cause. (Athey and Imbens 2017)
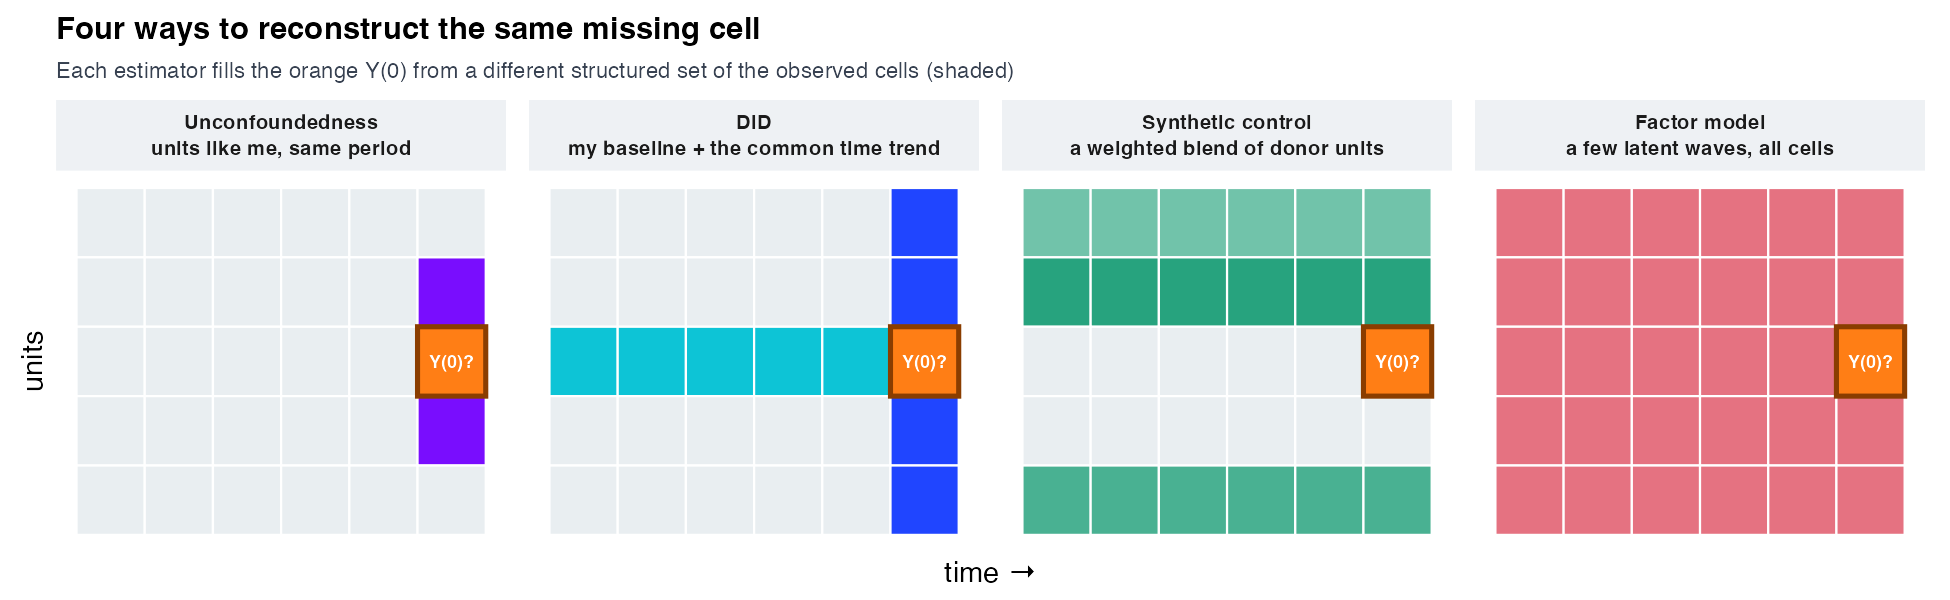
But once the design is settled — who is treated, when, which cells are clean controls — what remains is prediction: forecast the missing Y(0) from the observed cells, then subtract. (Athey et al. 2021)
FEct forces the interaction to rank zero
| Objective | \(L_{it}=\alpha_i+\lambda_t\) (no factor) |
| Borrows from | my baseline + the common time trend, fit on the white cells only |
| Regularizes by | strict additivity (parallel trends) |
| Dial position | r = 0 |
m <- feols(log_rev ~ 1 | sid + week, data = p[app_live == 0]); p$y0_hat <- predict(m, p)
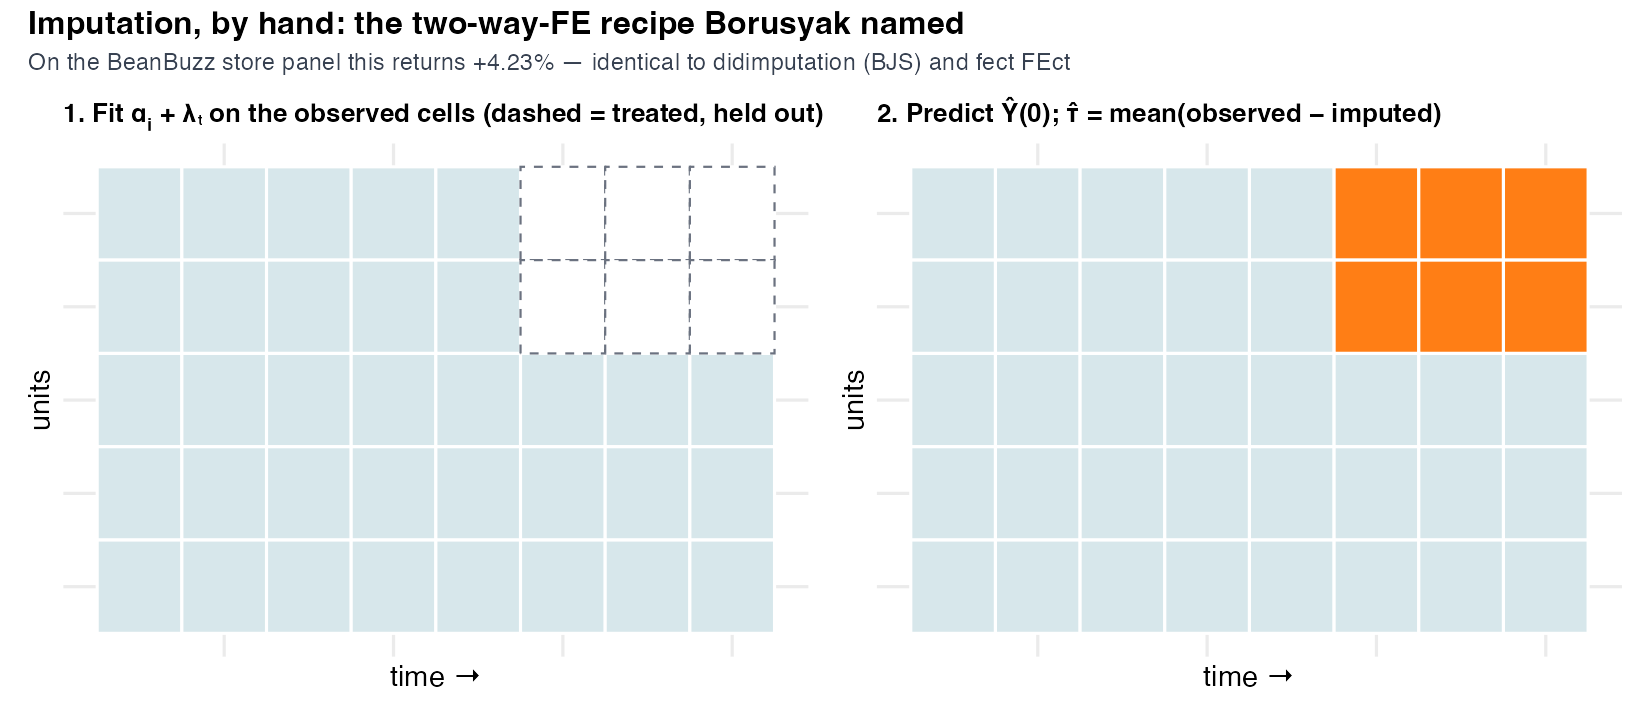
Fit on the untreated cells, predict the rest, average observed − imputed → +4.23%. This rung is the Borusyak–Jaravel–Spiess / Gardner imputation. (Borusyak, Jaravel, and Spiess 2024)
Three implementations, one number — to the digit
Three computations that look different:
fectFEct (method="fe")- BJS imputation (
didimputation) - hand-rolled
feols+predict
all return +4.23% — max abs diff \(< 10^{-5}\).
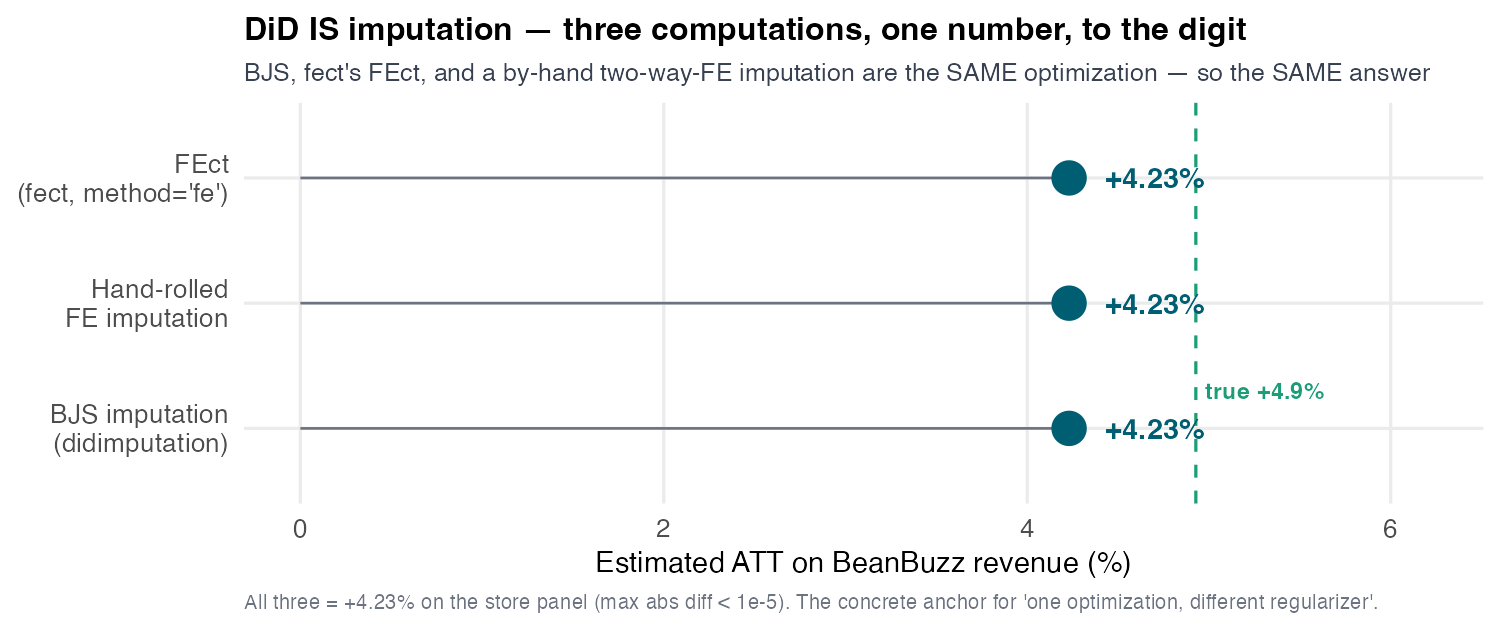
Not “about the same.” The same estimator, three ways — restricted two-way-FE imputation is a fixed linear operation, so any correct code must return it. (Gardner’s did2s lands here too — a coincidence exact only because there are no covariates.)
Blind, not biased: additivity cannot see the factor
The imputation is honest — clean-cell fit, no contamination — yet it lands at +4.23%, below the true +4.93%. It isn’t biased by selection — it is blind.
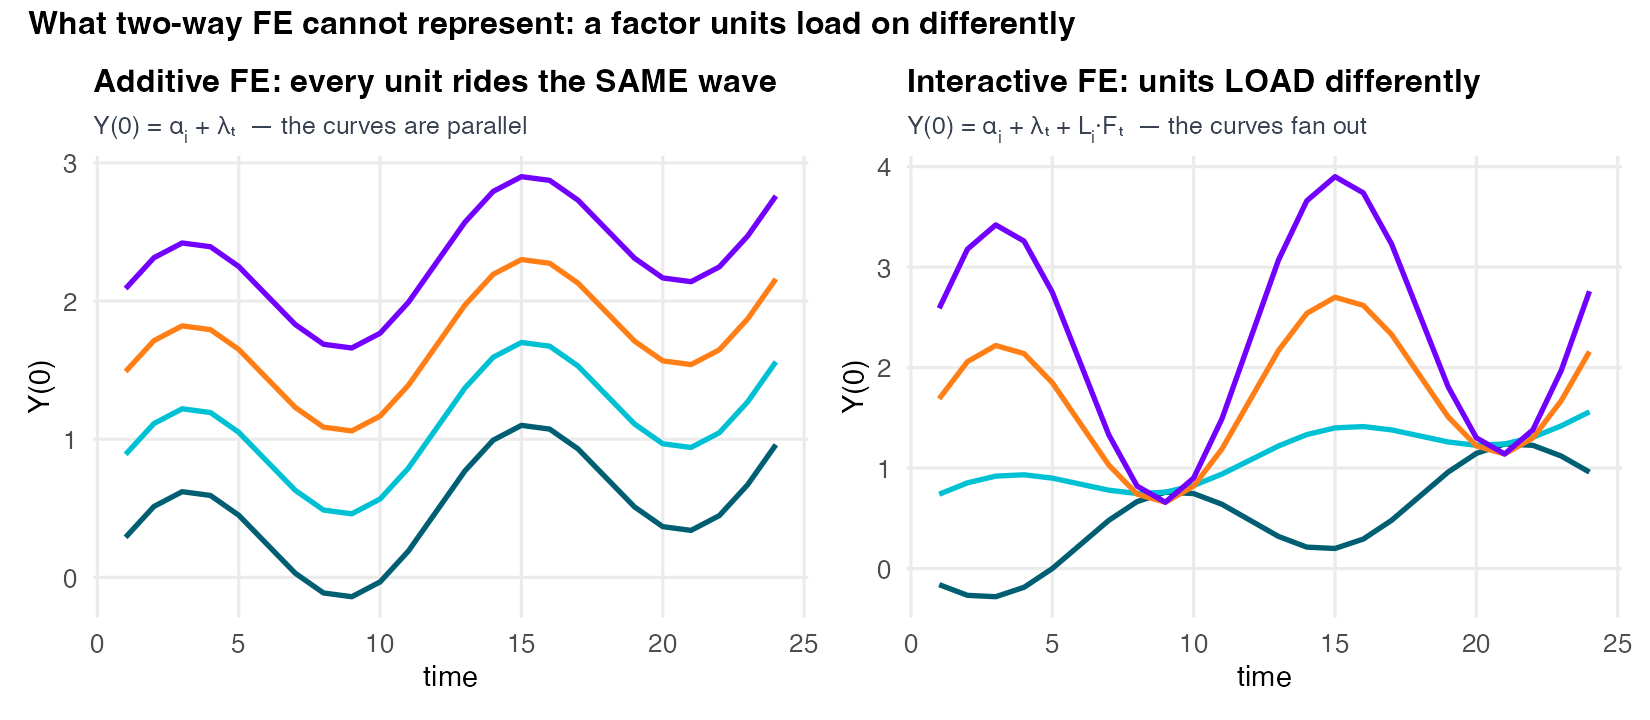
Two waves run through BeanBuzz. Whole regions boom and slump together, and some ride that cycle far harder than others — the big one. Fainter: winter footfall vs year-round routine makes urban stores ride the seasonal wave harder than roadside ones.
Low rank: the panel hides in two thin matrices

Both panels are one tool: the singular value decomposition (SVD). Split a matrix into \(U\Sigma V^{\top}\), keep the top \(r\), and you have the two thin matrices — \(\Lambda = U_r\Sigma_r\), \(F = V_r^{\top}\) — while the \(\sigma_k\) on the right are its spectrum. And \(\Lambda F\) is defined on every (store, week), including the 5,606 blanked cells: multiply, and the blanks are filled. That is completion.
IFEct hard-imputes a rank-r factor — CV picks r = 1
| Objective | \(L_{it}=\alpha_i+\lambda_t+\sum_{r} L_{ir}F_{rt}\) |
| Borrows from | a few shared latent factors everyone loads on |
| Regularizes by | a fixed rank \(r\) (hard-impute), CV-chosen |
| Dial position | r ≥ 1 (FEct is \(r=0\)) |
So which \(r\)? Cross-validation — no oracle needed: hide a block of pre-launch weeks you do observe, re-impute them at each candidate \(r\), and keep the simplest \(r\) whose held-out error is within one SE of the best. Here it picks r = 1. (Xu 2017; Liu, Wang, and Xu 2024)

plot(out.ife, type = "factors") — but read the legend twice.
0 is not a factor. It is the time effect \(\lambda_t\) — loading 1 for every store. A lift. The additive model already had it.
1 is the one CV bought. Its loadings run \(-0.069\) to \(+0.027\) — 18% negative. Same week, opposite directions.
A fan, not a lift — and that is what additivity cannot see.
Turn the dial: CV picks the rung, not the oracle
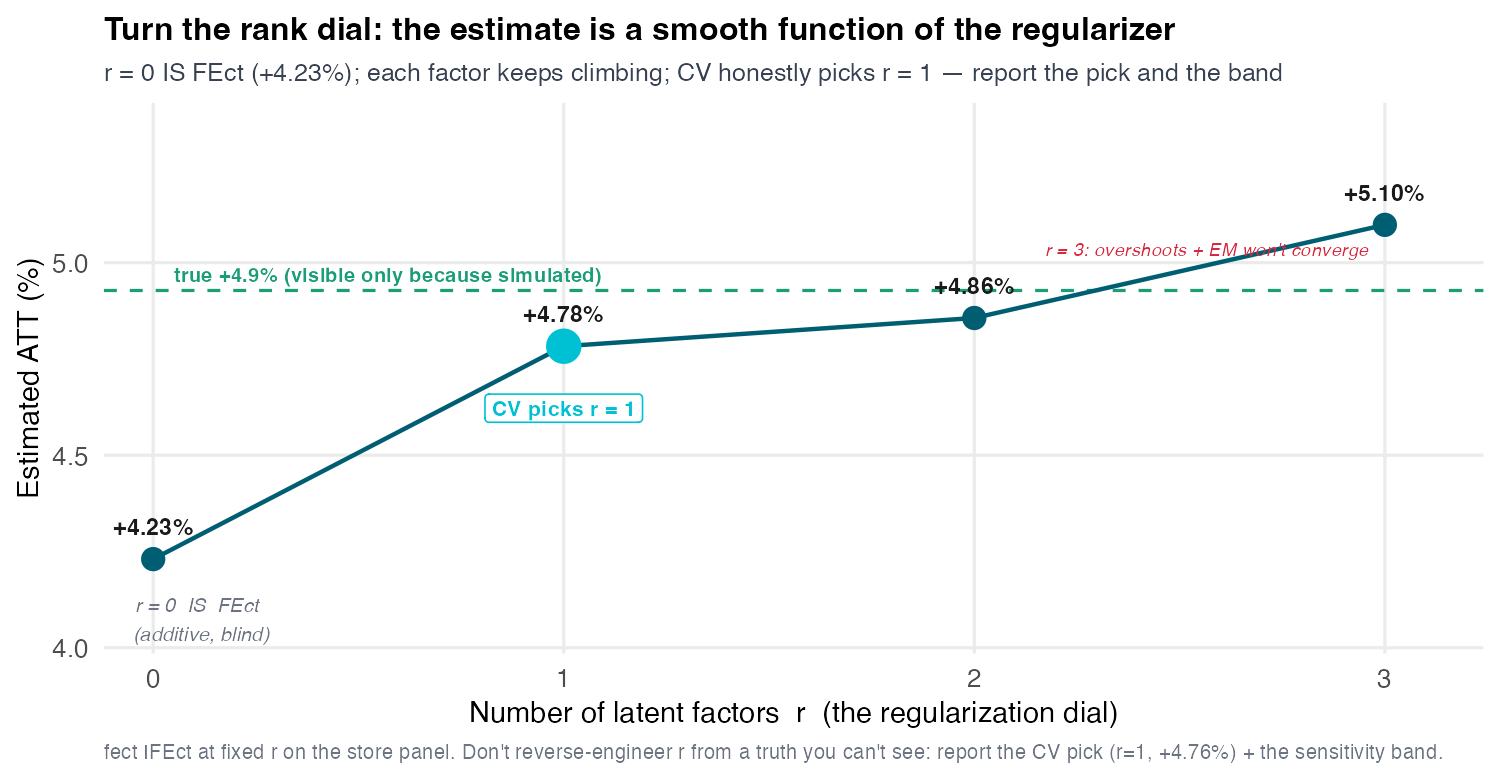
You pick the rung without the truth line:
- Hide a 3-week block of observed, pre-launch weeks in 10% of stores — and delete everything after it from training.
- Re-impute the block at each candidate \(r\); score the held-out error.
- Keep the simplest \(r\) within one SE of the best — here r = 1.
Refit at fixed \(r\) and the estimate is a smooth function of the regularizer: r = 0 IS FEct (+4.23%) → r = 1 +4.78% → r = 2 +4.86% → r = 3 +5.10% (overshoots; the EM stops converging).
+4.76% is the average of a ramp — not a level
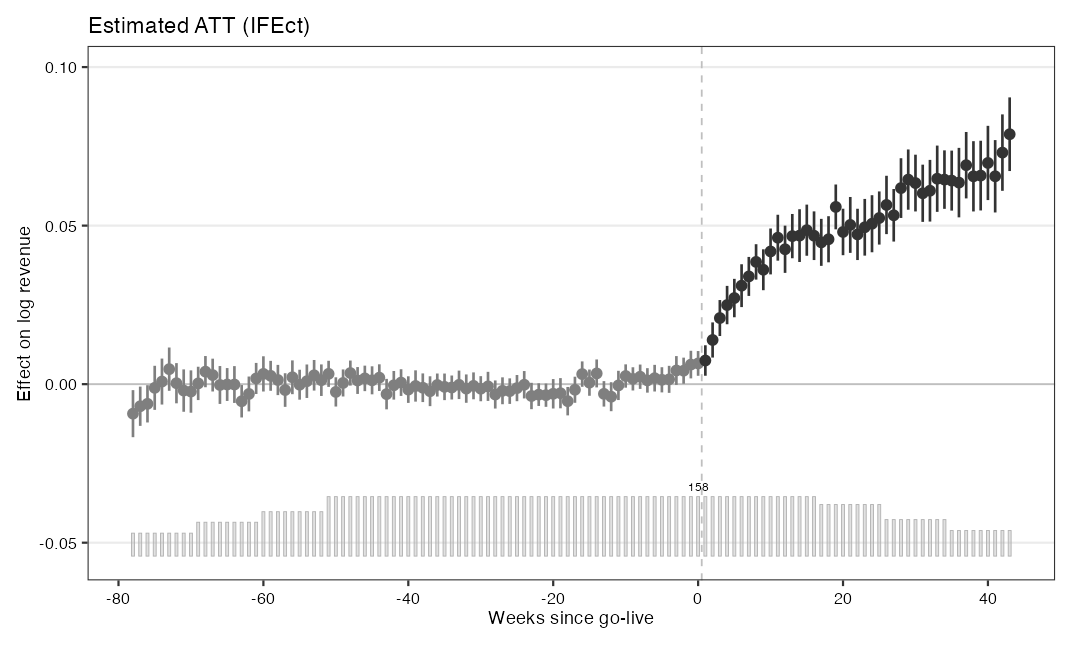
plot(out.ife, main = "Estimated ATT (IFEct)")
Before: flat on zero. That flatness is a claim — the Sensitivity act audits it.
After: a ramp, not a jump — +0.7% wk 1 → +4.3% wk 12 → +6.6% wk 52.
Adoption is a diffusion, not a switch.
So +4.76% is not “the effect.” It is the mean over the post-window you chose — and the window is a choice.
MC soft-imputes by shrinking the singular values
The nuclear norm = the sum of a matrix’s singular values; penalizing it shrinks them toward zero. That is what “encourages low rank” — and it is the same objective, a softer knob. (Athey et al. 2021)
| Objective | \(\min_L \sum_{\mathcal{O}}(Y-L)^2 + \lambda\lVert L\rVert_{*}\) |
| Borrows from | a low-rank reconstruction — all factors, shrunk |
| Regularizes by | the nuclear norm \(\lVert L\rVert_*\) (soft-impute), CV-\(\lambda\) |
| Dial position | soft — and MC → FEct once \(\lambda\) exceeds \(\sigma_{\max}\) |

Same panel. Same picture. A different number.
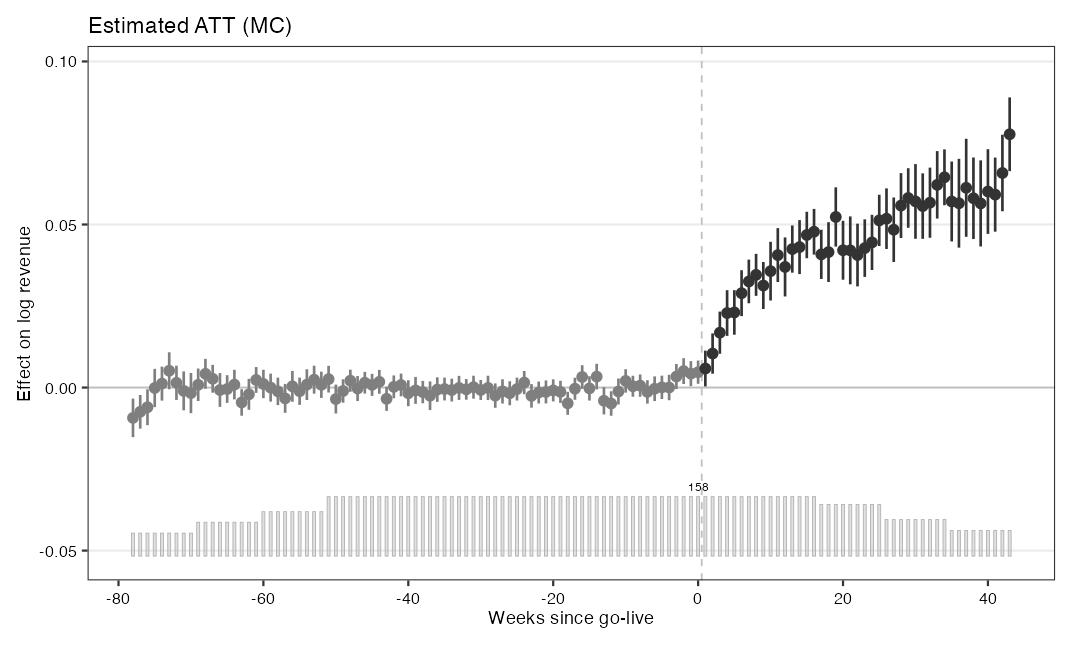
plot(out.mc, main = "Estimated ATT (MC)")
Flat before. Ramps after. The same shape — the two post-launch paths correlate 0.99.
| ATT | 95% CI |
| IFEct +4.76% | [+4.23, +5.28] |
| MC +4.31% | [+3.73, +4.89] |
Seeing the factor closes the gap — but more flexible isn’t more right
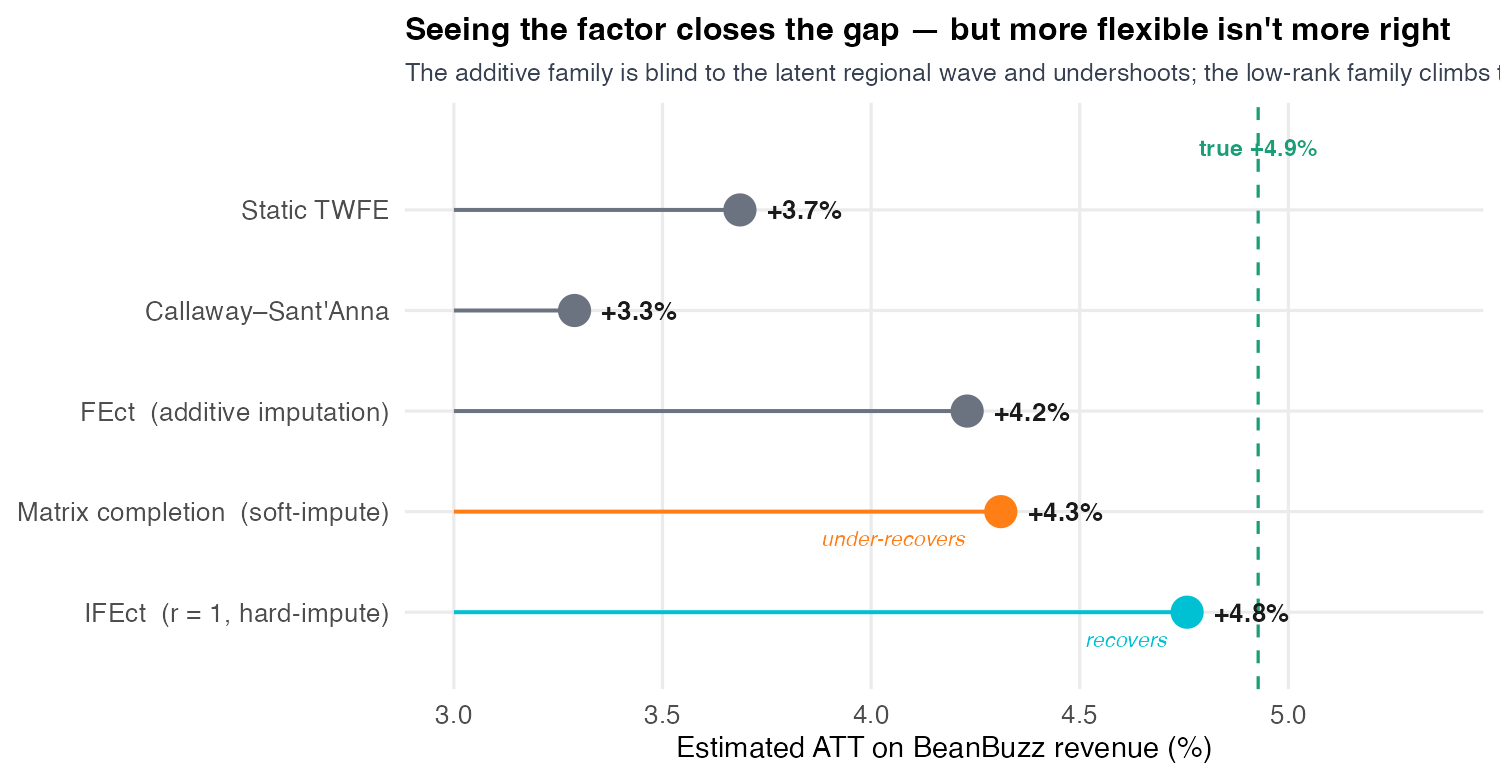
Additive family (blind to the latent wave) undershoots; IFEct +4.76% recovers; but matrix completion +4.31% under-recovers — its nuclear norm shrank the very factor we needed. More flexible ≠ more right.
Test 1 · Placebo — it fires, and it is small
Why. The pre-period fit is in-sample — the model was fitted on those cells. So blank three you do observe and make it re-impute them out of sample.
\(H_0\) · t-test: \(\text{ATT} = 0\) on the blanked window \(\{-2,-1,0\}\).
\(H_0\) · TOST (two one-sided tests): \(|\text{ATT}| \ge \theta = 1.44\) pp.
out.p <- fect(..., method = "ife", r = 1,
              placeboTest    = TRUE,
              placebo.period = c(-2, 0))

plot(out.p, stats = c("placebo.p", "equiv.p"))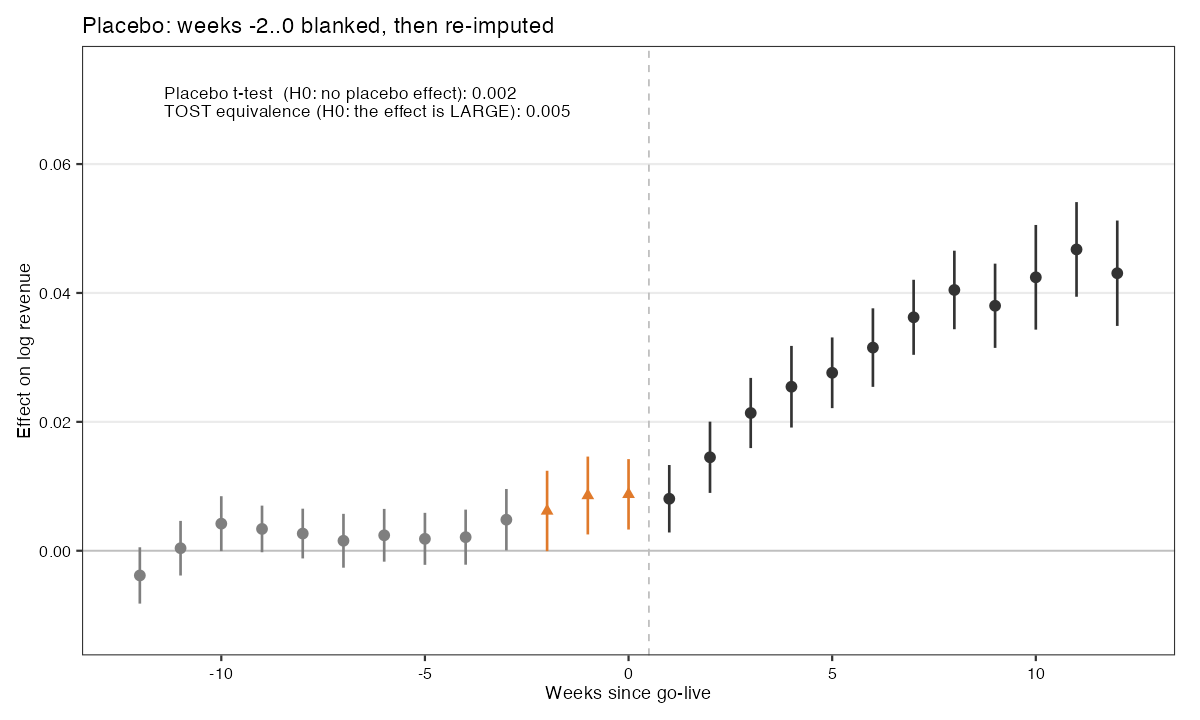
Test 2 · LOO pre-trend — nothing certifies
Why. Every pre-period so far was in-sample — the model was fitted on it. LOO re-imputes every pre-period \(t\) from a model that never saw \(t\): 88 refits, 79 tested.
out.loo <- fect(..., method = "ife", r = 1,
                loo = TRUE)

plot(out.loo, type = "equiv", loo = TRUE)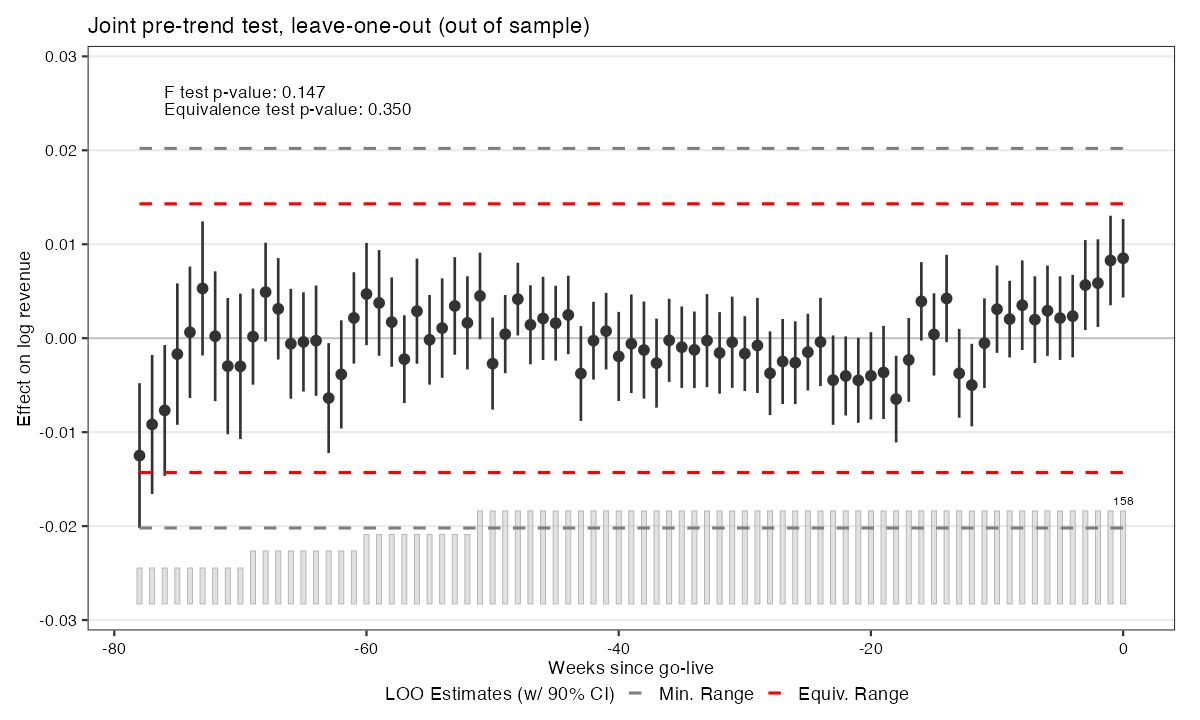
| test | \(H_0\) | in-sample | LOO | what the number means |
| F | no pre-trend | 0.126 | 0.147 | cannot reject → absence of evidence. Never certifies. |
| F-equiv. | the pre-trend is LARGE | 0.019 | 0.015 | rejects → it certifies — but it averages, and averages forgive. |
| TOST | SOME pre-period is LARGE | 0.082 | 0.350 | cannot reject → no certificate. Intersection–union ⇒ the worst of 79, so it alone quadruples. |
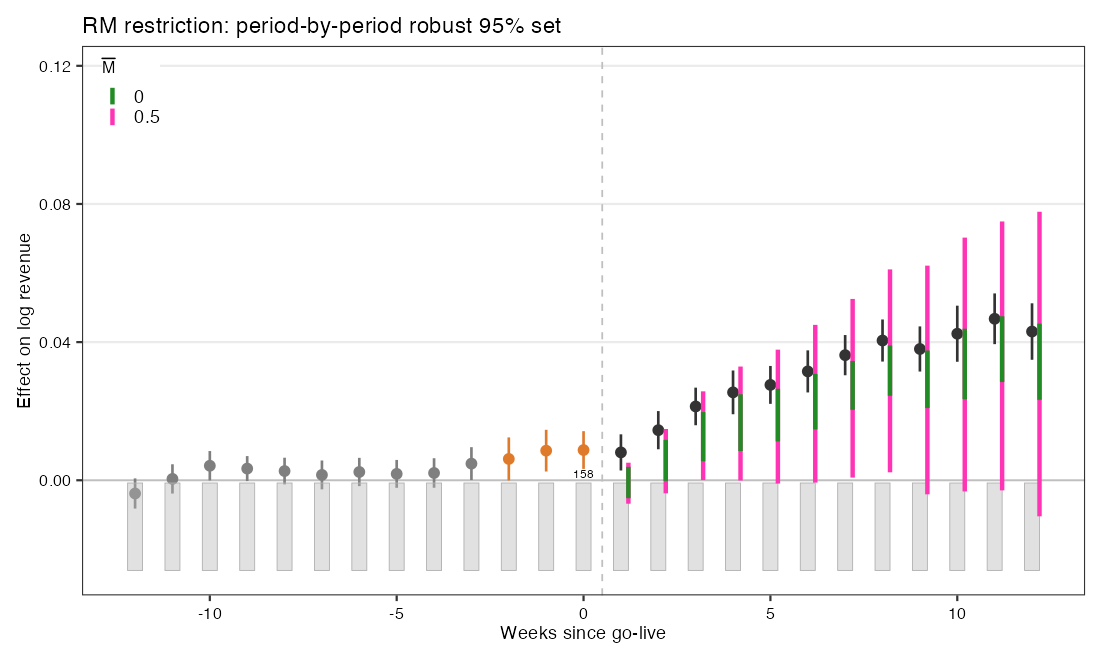
Test 3 · RM — the answer survives to \(\bar M^{*} = 0.46\)
Why. Don’t assume parallel trends — bound the violation by the drift the placebo measured: \(\Delta^{RM}(\bar M)=\big\{\delta: |\delta_{t+1}-\delta_t| \le \bar M R\big\}\), with \(R\) = Test 1’s ruler = 0.240 pp.
s <- fect_sens(out.p,
        post.periods  = 1:12,
        Mbarvec       = seq(0, 1, 0.05),
        periodMbarvec = c(0, 0.5))

plot(s, type = "sens",    restrict = "rm")
plot(s, type = "sens_es", restrict = "rm")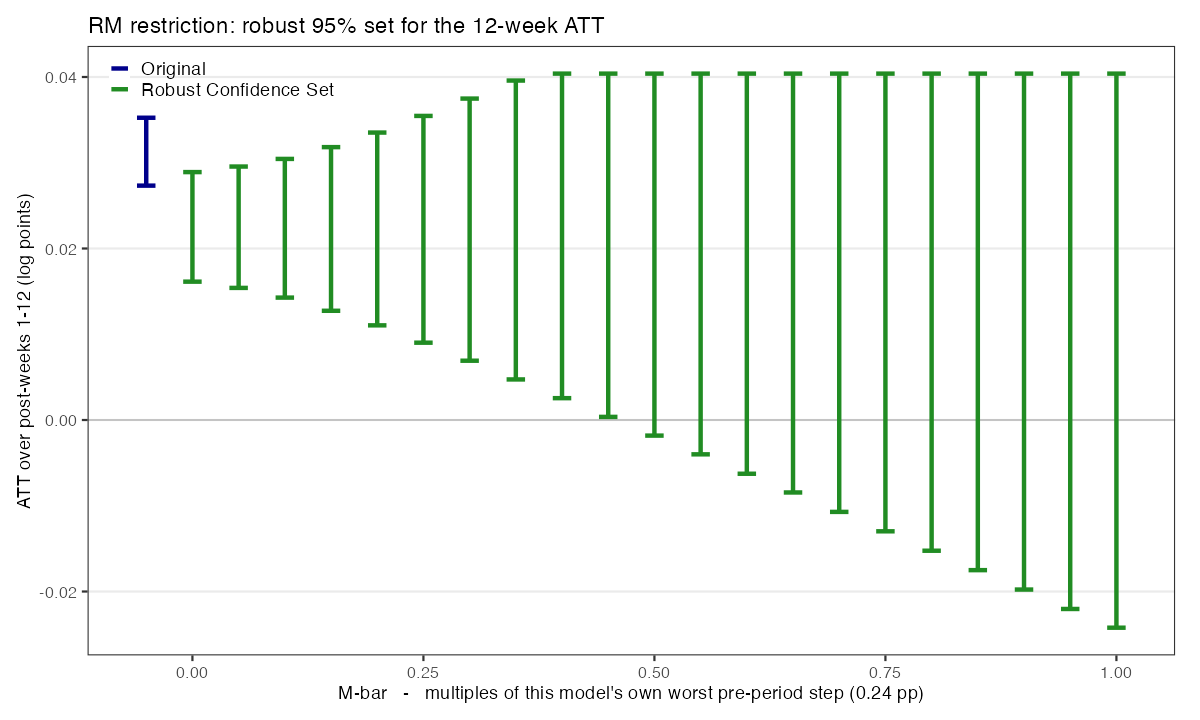
Test 4 · Smoothness — it dies at \(M^{*} = 0\)
Why. Bound the curvature, not the step: \(\Delta^{SD}(M)=\big\{\delta: |(\delta_{t+1}-\delta_t)-(\delta_t-\delta_{t-1})| \le M\big\}\) ⇒ \(M{=}0\) makes the violation exactly linear — not zero.
s <- fect_sens(out.p,
        post.periods = 1:12,
        Mvec       = seq(0, 0.010, 0.002),
        periodMvec = c(0, 0.004))

plot(s, type = "sens",    restrict = "sm")
plot(s, type = "sens_es", restrict = "sm")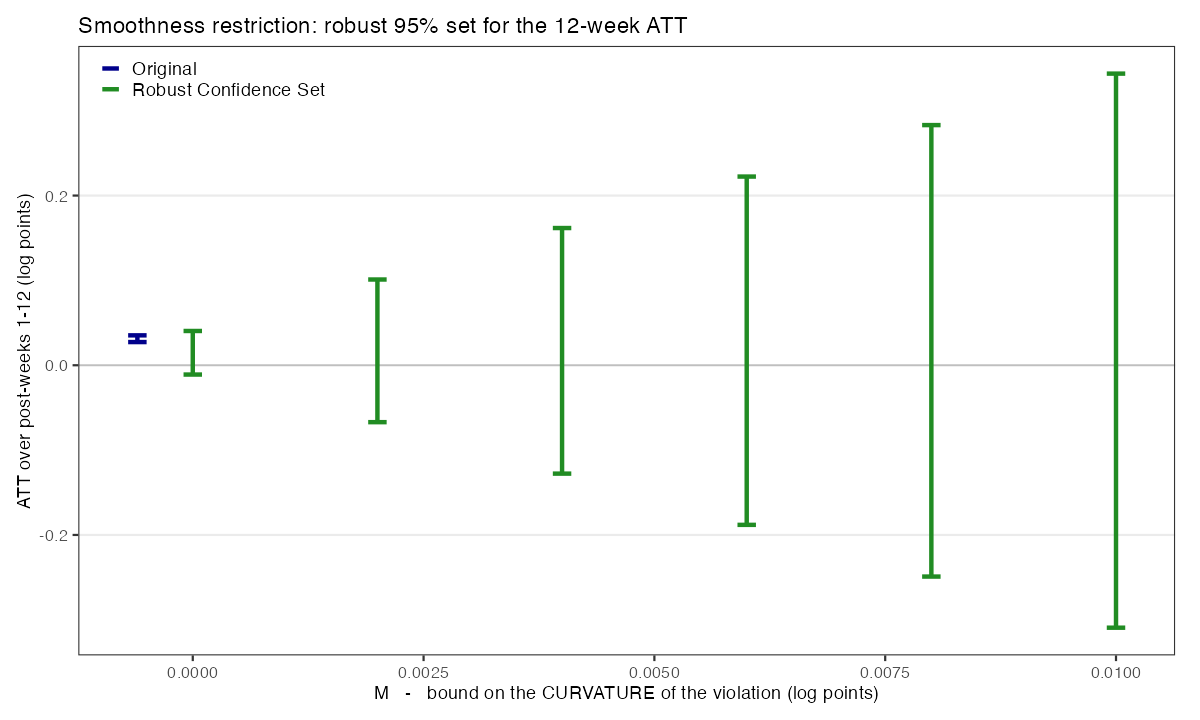
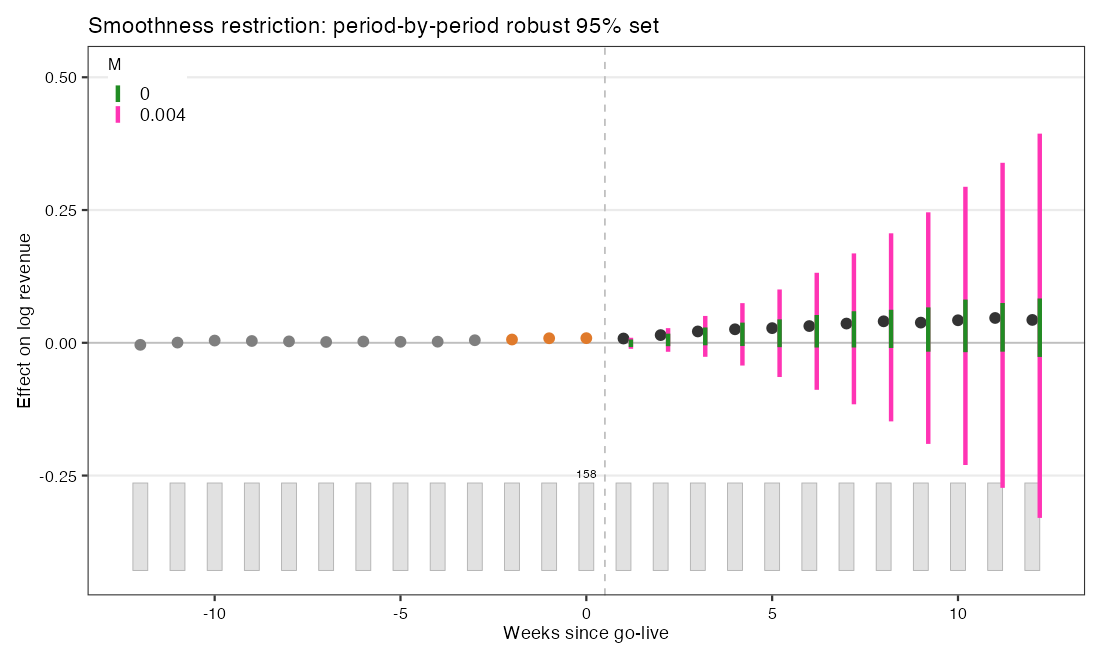
Same fit, two axes, two illusions
Why. Don’t aggregate at all — read the cells. Is the app hurting some stores? plot(f, type = “box”)
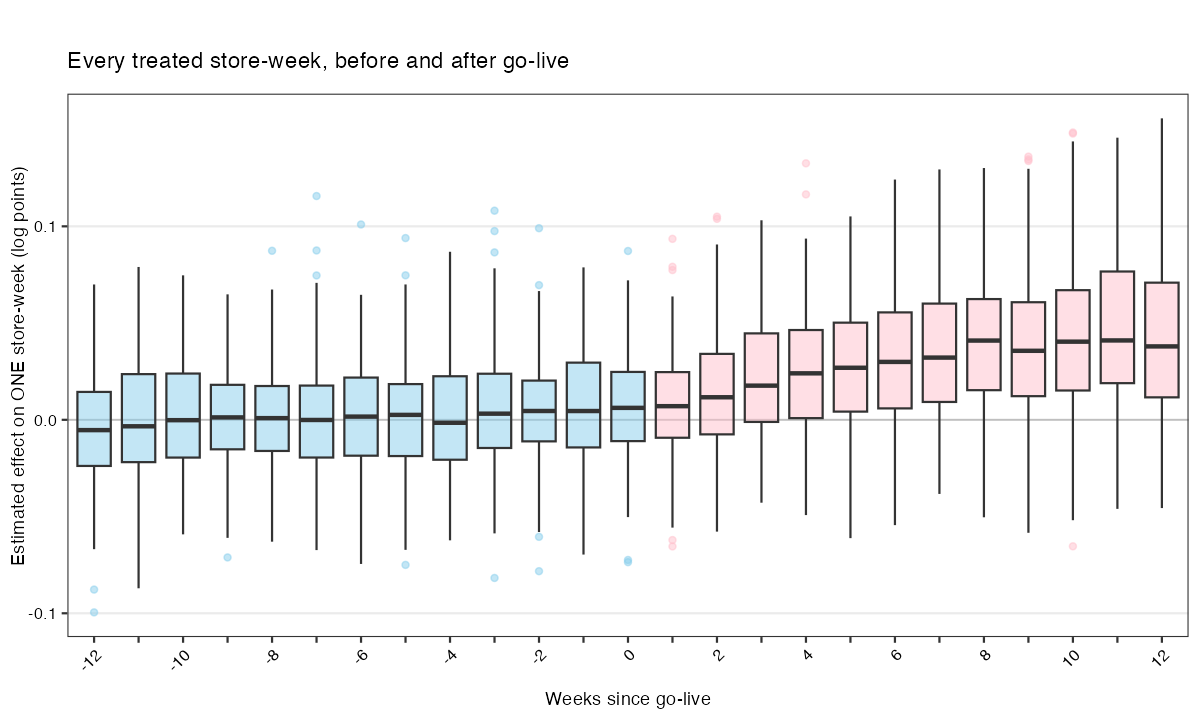
Looks like. 21.4% of the 1,896 post cells read negative (week 1: 38.6%) — “switch the app off in the stores it’s hurting.”
But. 48.0% of the blue cells do too — before go-live, no app. The unit FE is fitted on exactly those cells, so half must land below. The null is 50, not 0 — the losers are noise.
Read it as ⇒ the LOCATION, never a box. Pre: median ≈ 0. Post: it lifts and keeps lifting — +0.7% at launch → +4.1% by week 8. That climb is the effect. The width is error, not heterogeneity: it grows with the horizon (IQR 3.4 → 5.9 pp).
Why. Fine — aggregate, and ask when. Does the app work better in some weeks? plot(f, type = “calendar”)
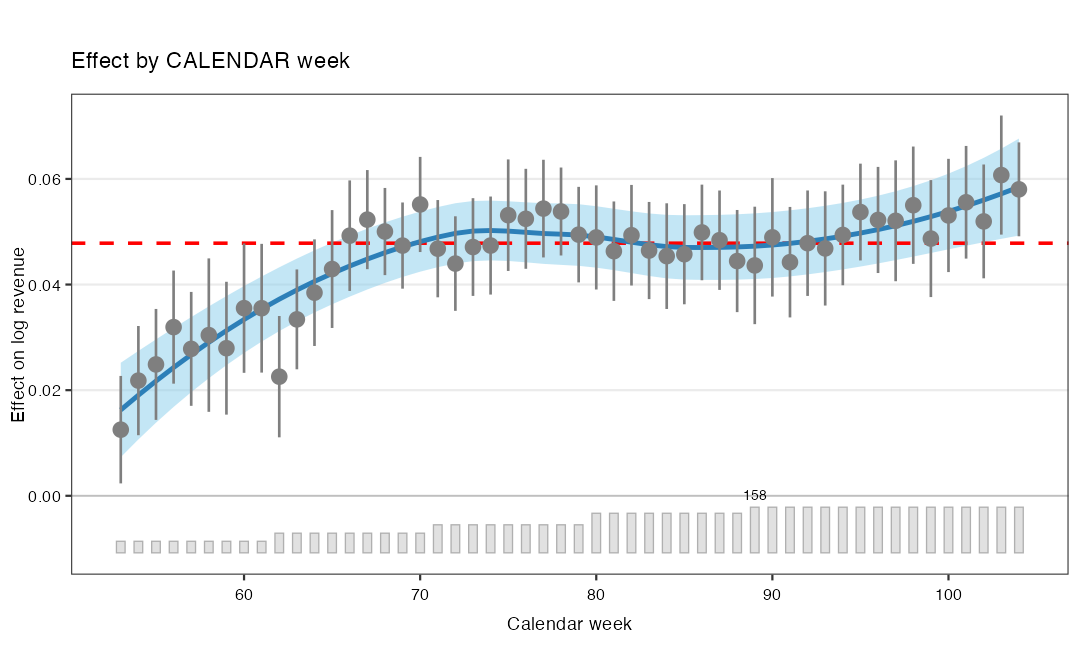
Looks like. +1.25% (wk 53) → +5.80% (wk 104) — a 4.8 pp swing, as large as the ATT itself. “It compounds: the app works better later in the year.”
But. No calendar is in it. Calendar time and tenure move together here: wk 53 is 40 stores at tenure 1, wk 104 is 158 at mean tenure 35. Rebuild the curve with no calendar term: inside the CI in 48 of 52 weeks. It tracks the grey bars — the rollout.
Read it as ⇒ DELIVERY, not modification. What the live fleet actually earned each week — true, and the right plot for that. High late because the fleet is mature. For “when does it work better?” you must hold tenure fixed; this plot cannot.
Route 1 — group=: split the panel, and let fect refit
A discrete split needs no covariate in the model at all — there is no slope for the unit FE to absorb. fect refits each group and bootstraps it.
df$urban_tertile <- cut(u,
  quantile(u, c(0, 1/3, 2/3, 1)),
  include.lowest = TRUE,
  labels = c("Low urban",
             "Mid urban",
             "High urban"))

fg <- fect(log_rev ~ app_live,
  data = df,
  index = c("sid","week"),
  method = "ife", r = 1,
  force = "two-way", se = TRUE,
  group = "urban_tertile")

fg$est.group.att| group | ATT | S.E. |
|---|---|---|
| Low | +1.60% | 0.21 pp |
| Mid | +4.61% | 0.21 pp |
| High | +7.34% | 0.21 pp |
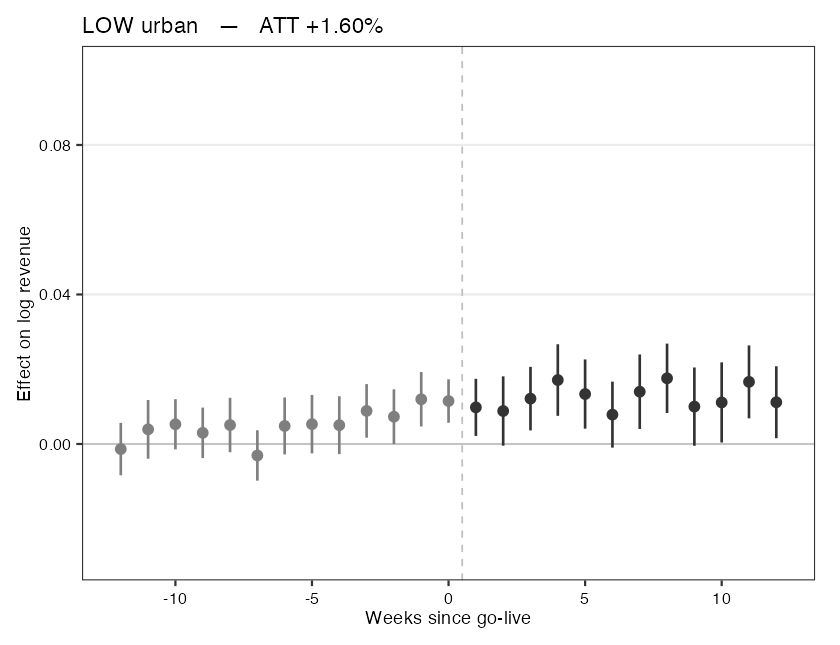
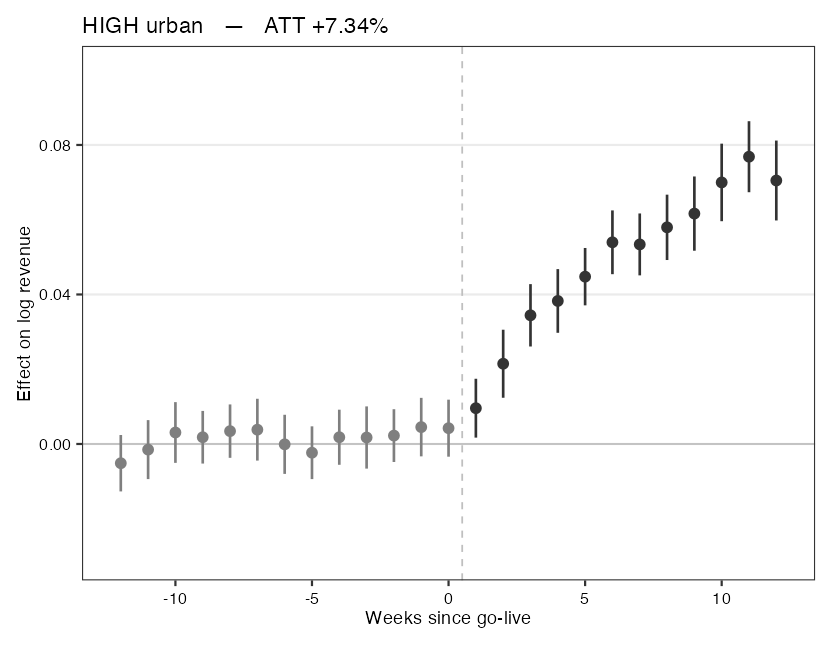
Read it as ⇒ same axis, two panels — the heterogeneity is the gap between them. Low is flat at ~+1%; High ramps to ~+7%. A 5.75-point spread, SE 0.21 pp, intervals nowhere near touching. This is the aggregation that buys back what the cell forbade — and its band is a real bootstrap.
Route 2 — type="hte": build the covariate
type="hte" smooths the cell effect against a covariate’s raw level — so the covariate must be in the model, and it must clear four hurdles:
| it must… | or else — and what it kills |
|---|---|
| 1. vary within store |
the unit FE eats it → “unit-invariant”. Kills all 6 store attributes — incl. urban_share
|
| 2. be nonzero on the untreated cells |
fect fits Y(0) only there. urban_share × app_live is identically 0 → collinear. The moderator is only “on” where fect refuses to look.
|
| 3. not be moved by the treatment |
else it is a bad control. Kills mktg_spend: +€251, t = 130
|
| 4. not be a clock |
else you are plotting the tenure ramp. Kills temp_c (95% week) and footfall_index (88%)
|
No raw covariate in the panel clears all four. So build one:
df$urban_x_week <- df$urban_share * df$week

fuw <- fect(log_rev ~ app_live + urban_x_week,
   data = df, index = c("sid","week"), method = "ife",
   r = 1, force = "two-way", se = TRUE)

plot(fuw, type = "hte", covariate = "urban_x_week")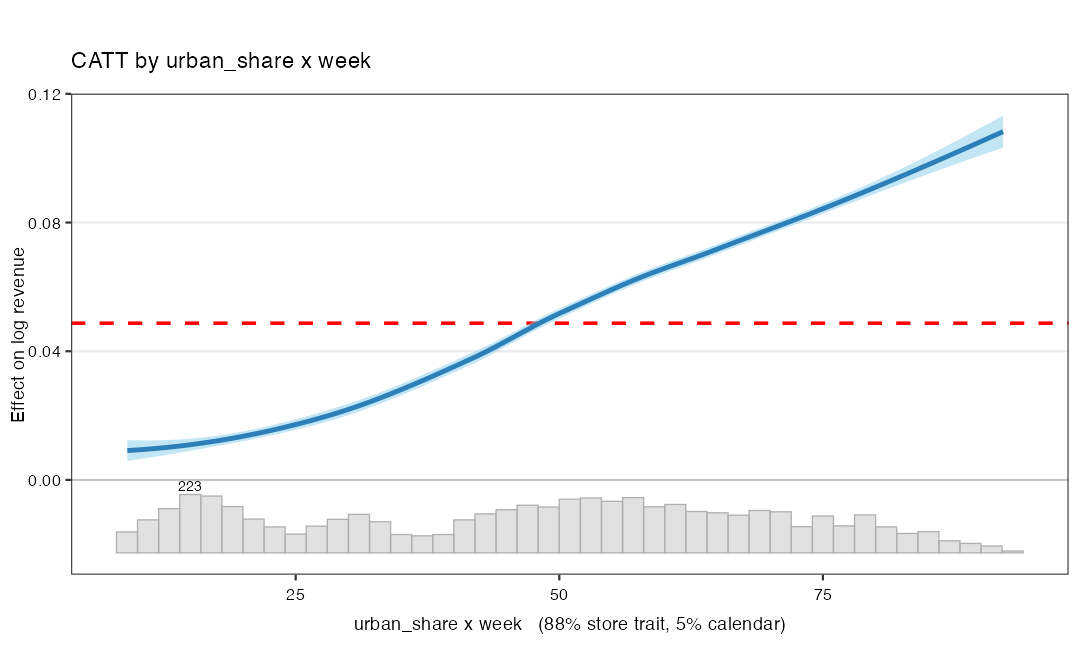
It clears all four. Within-store sd 15.8 ①; sd 17.5 on the untreated cells ②; deterministic in (store, week) — the treatment cannot move it ③; and on the treated cells it is 88% store trait, 5% calendar ④ (the treated calendar spans 2×; urban_share spans 9× — the product is urbanity, not time).
Read it as ⇒ a continuous gradient (+0.9% → +10.8%) that agrees with group= — at two prices: the covariate is in the model, so it moved the estimator (+4.78% → +4.87%); and the ribbon is a loess SE over 5,606 cells treated as independent — it never touches the bootstrap, even here with se = TRUE.
⇒ group= GIVES A BAND. type="hte" GIVES A SHAPE.
| Thank you for your attention! | |

 |
|