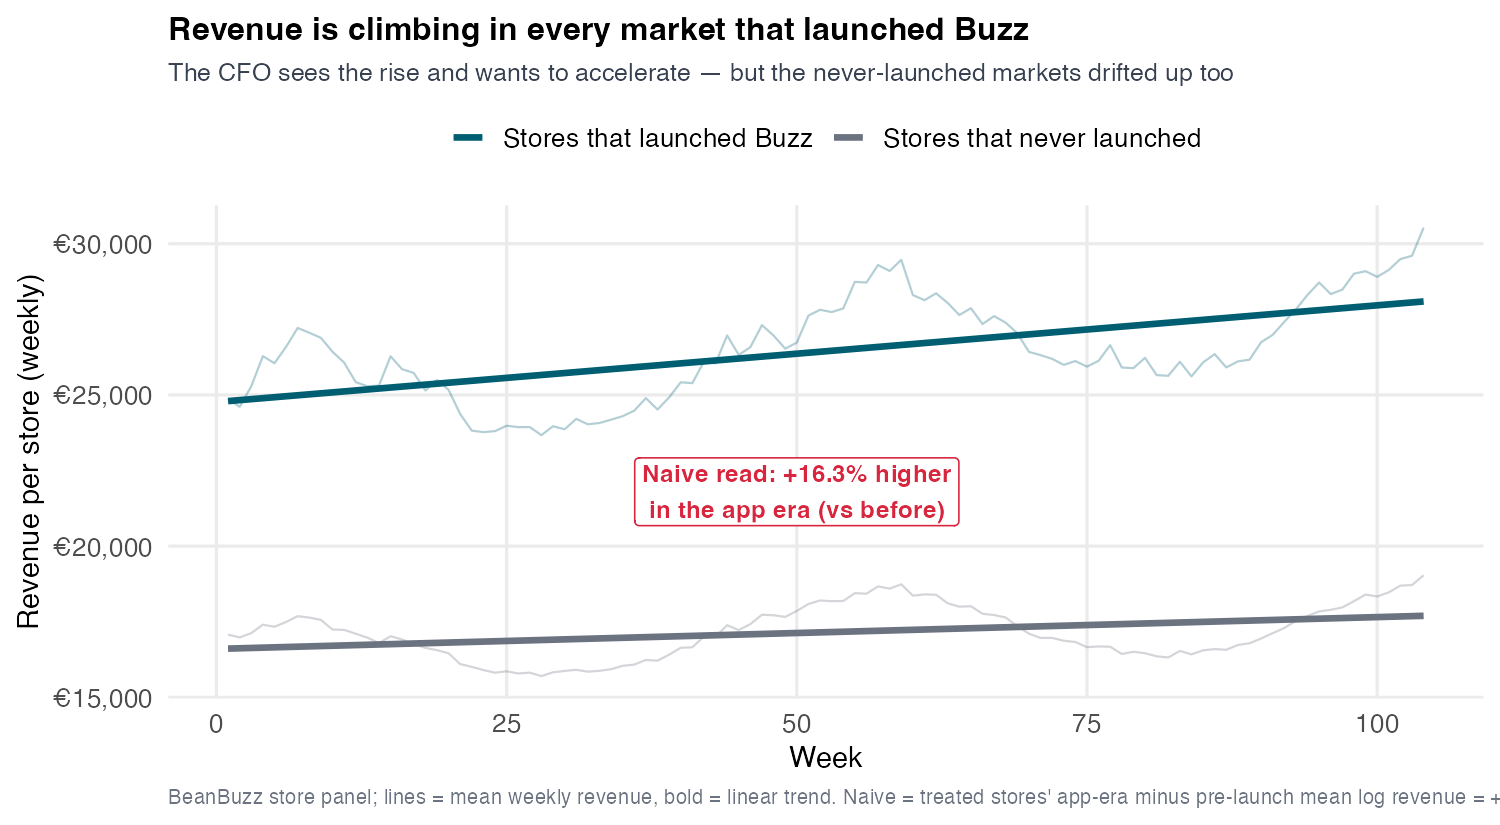
BeanBuzz rolled its loyalty app out market by market: every launched market’s revenue climbs after go-live, and the memo asks — accelerate the rollout?
Outcome \(Y\) = log weekly revenue → effects read as percent; higher is better — the opposite of last assignment’s cost outcome.
The seductive read — each market’s revenue after the app vs before — books +16.3%. It is also wrong, and the rest of the session is why.
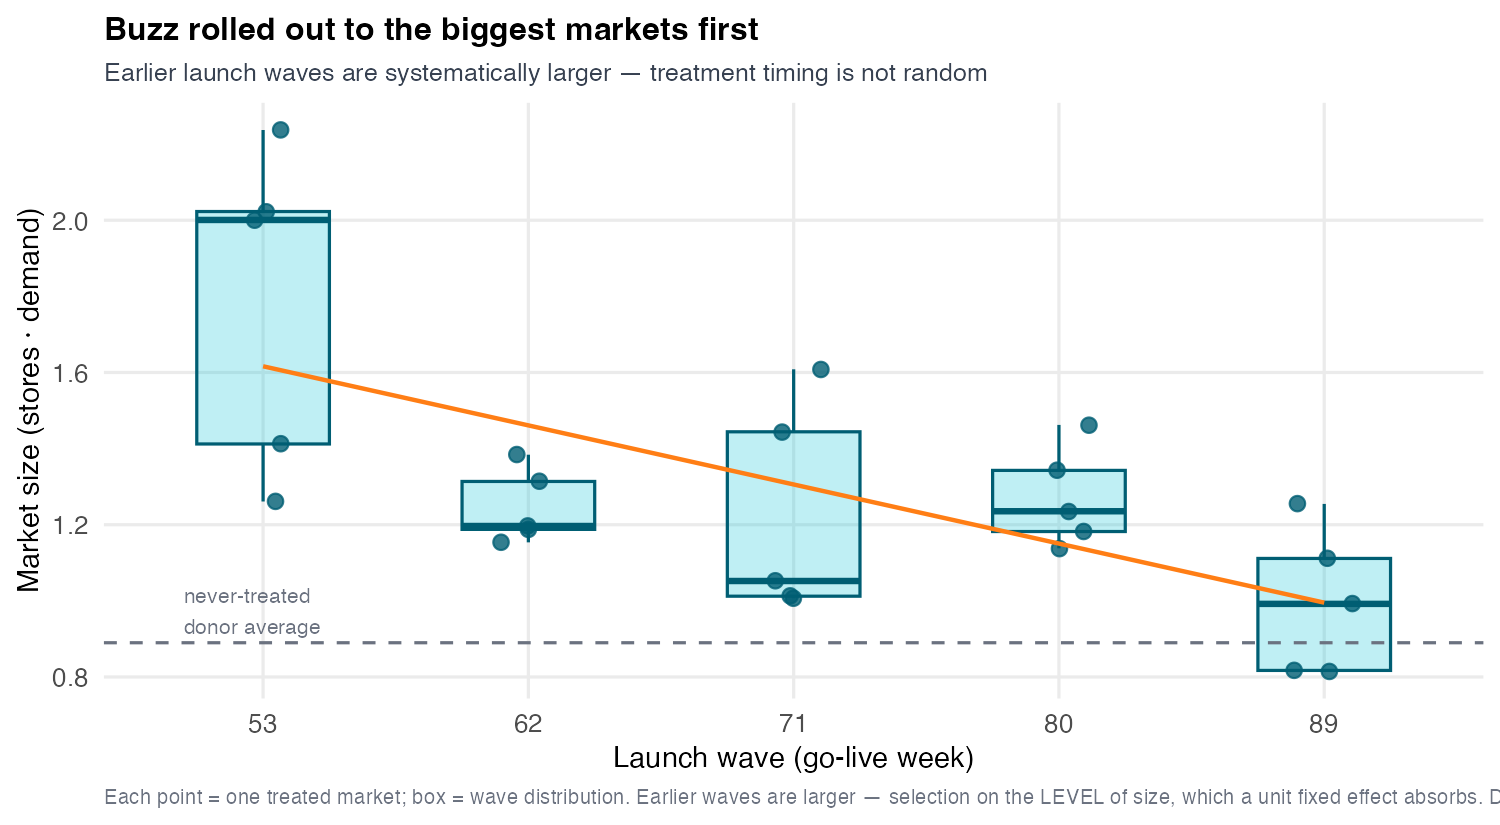
Buzz launched in its biggest markets first
The rollout was not random — the biggest markets went first. That is selection on the level of size, which a unit fixed effect absorbs. What would break DiD is selection on the trend — and this rollout avoids it.
Subtract the trend they would have had anyway
The whole method, compressed
Subtract the common time trend the control would have had anyway. What’s left is the app’s effect.
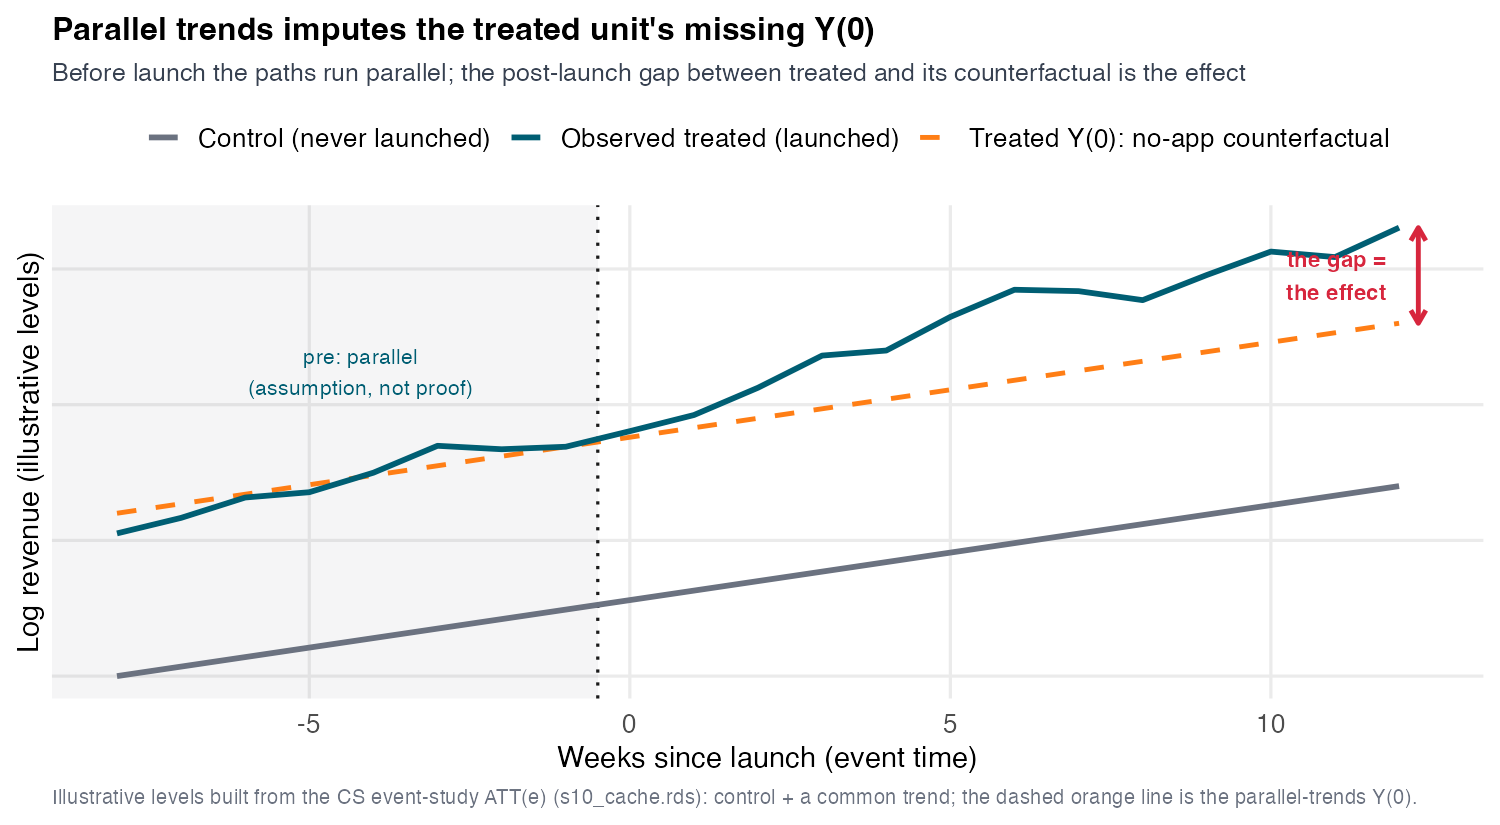
That subtraction is an imputation of the missing Y(0): we fill each treated market’s unseen no-app path using markets that didn’t (yet) get the app.
The Part V spine: impute the missing Y(0) under escalating assumptions. S10 uses additive unit + time effects — exactly the parallel-trends assumption. S11 relaxes it (synthetic control); S12 generalizes it (counterfactual imputation).
Basic 2×2 Model
Start with two markets and four numbers
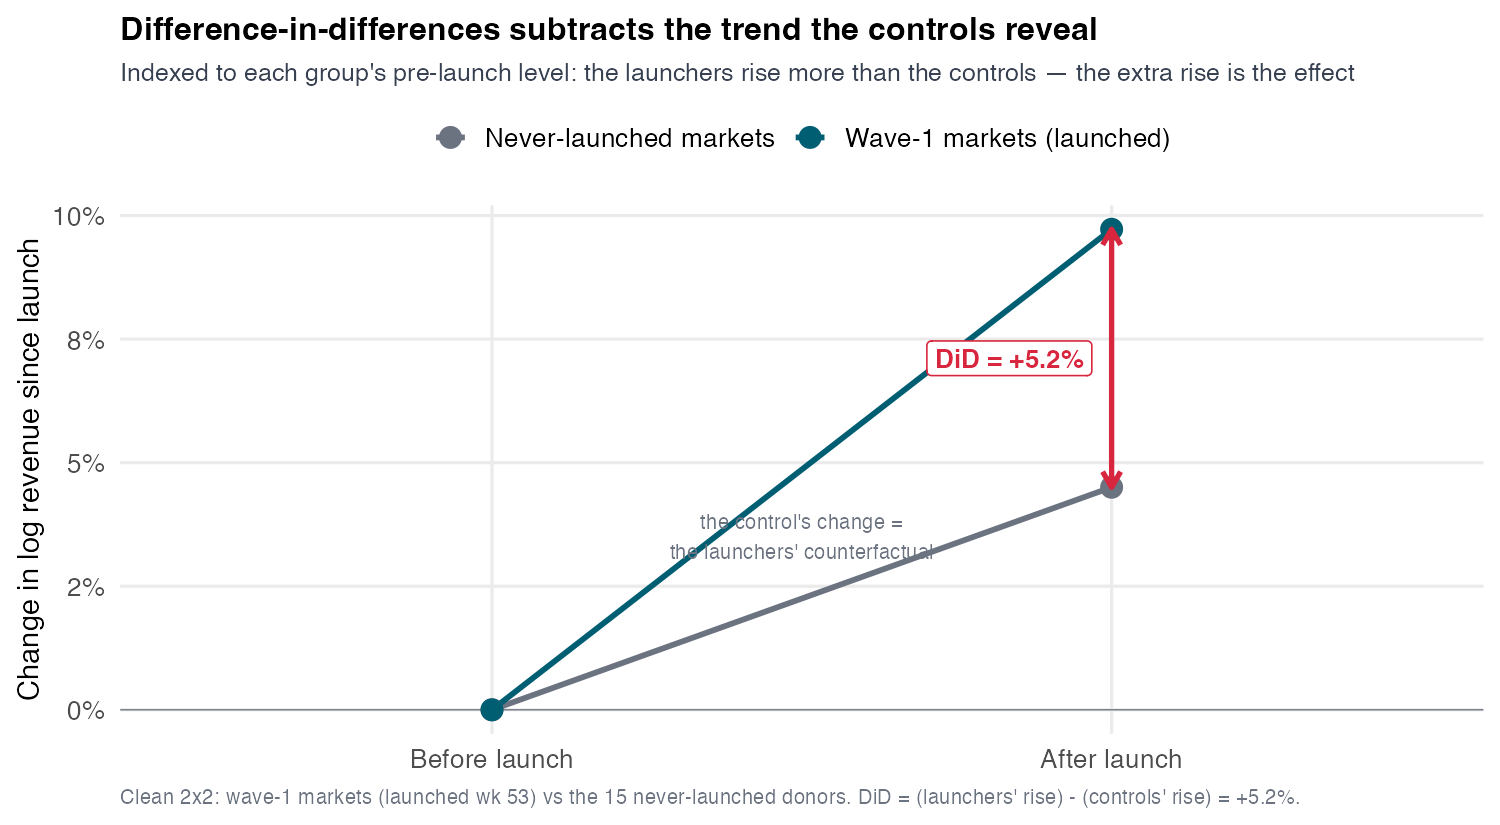
Strip it to the bone: the wave-1 launchers, the never-launched markets, two periods. Four cell means — that’s the entire engine.
The jump confounds two things — the control isolates one
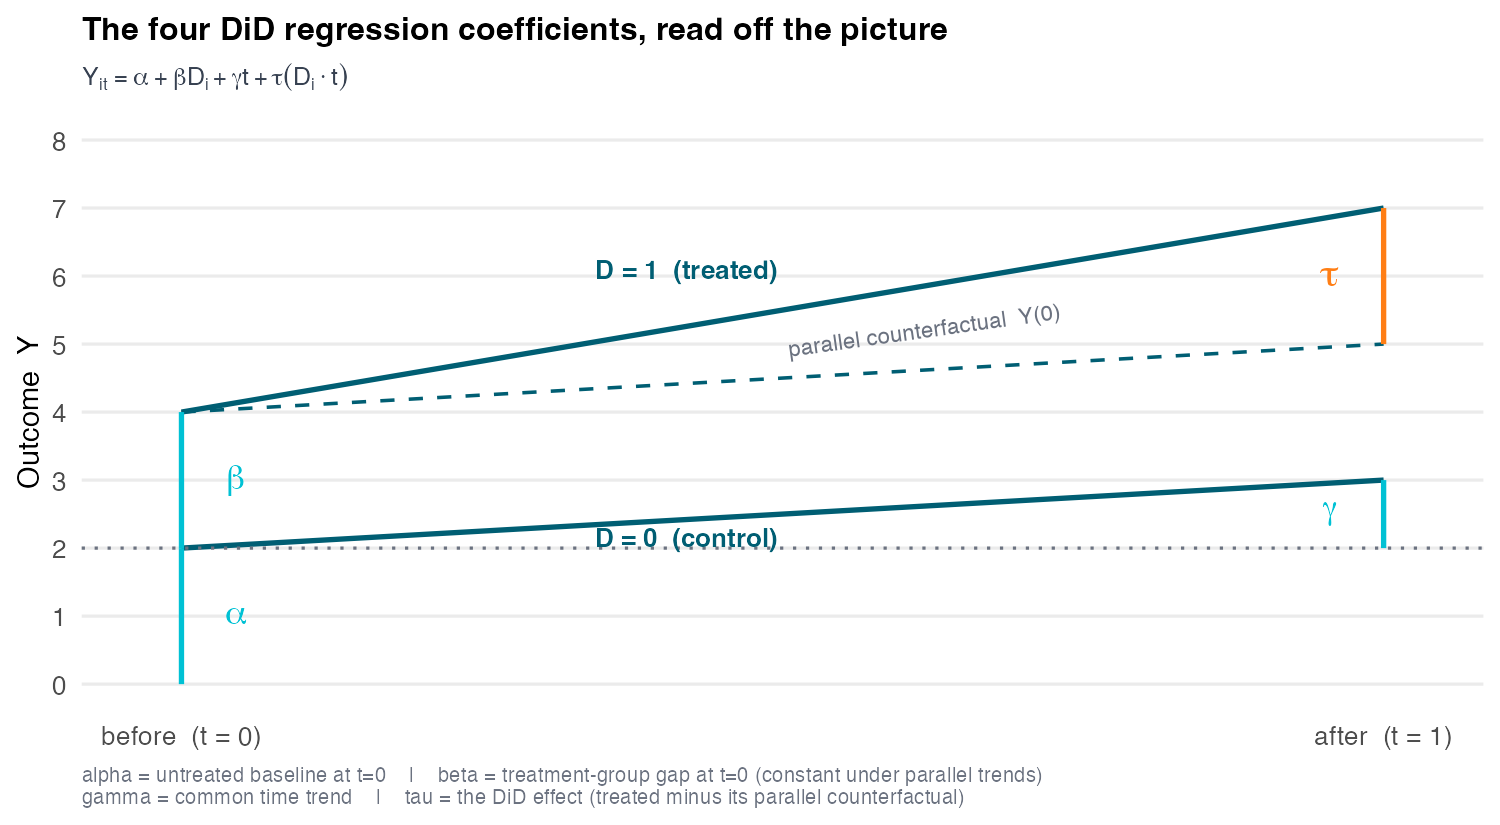
Look only at the treated market: its pre-to-post jump bundles two movements one market can’t separate — the app’s effect and everything else (winter seasonality, the macro trend that lifts every market). It’s the +16.3% mistake in miniature.
The never-treated donor got no app — so its pre-to-post change is pure time. Borrow it:
The borrowed counterfactual
We assume the treated market would have moved by the same amount as the control absent the app — so the control’s \(\Delta\)is the treated market’s unseen Y(0) trend.
DiD = the jump minus the trend it would have had
Subtract the control’s change from the treated market’s change:
The second term is the imputed Y(0) trend. What survives the subtraction is the app’s effect, free of the common time movement.
On the wave-1 launchers vs the never-launched markets: DiD = +5.2% — far below the naive +16.3%.
The early-cohort building block — not the portfolio-wide ATT, which the robust estimators pin near +3.3% once all cohorts pool (the robust menu).
The whole method rests on one claim: parallel trends
DiD is valid iff the treated market would have tracked the control absent the app — the dashed Y(0) path. Parallel trends is the assumption you must defend — no-anticipation and no-interference ride along (stated shortly).
Two separate jobs, done in order: first get a credible number, then interrogate this assumption. We can’t test it directly, so we save it for last.
The estimand: the effect on the treated, after launch
DiD targets the Average Treatment Effect on the Treated (ATT) — the app’s effect on the markets that actually launched, in the periods after they did:
Why the ATT and not the ATE? Because DiD asks for less. The ATE would need full unconfoundedness — treated and control comparable on both potential outcomes. DiD needs only the treated group’s untreated path to be borrowable — a one-sided condition on \(Y(0)\).
Weaker ask, narrower answer
Randomization buys the ATE. DiD trades it for the ATT — a narrower estimand — in exchange for the weaker, one-sided parallel-trends assumption you can actually defend. It is the unconfoundedness of S06–S09, moved from levels to changes.
Three assumptions, stated once
Parallel trends does the heavy lifting — but it is not alone. DiD identifies the ATT under three:
(A1) Parallel trends
\(\mathbb{E}[\,Y_{\text{post}}(0){-}Y_{\text{pre}}(0)\mid \text{treated}\,] = \mathbb{E}[\,Y_{\text{post}}(0){-}Y_{\text{pre}}(0)\mid \text{control}\,]\) — absent the app, the two groups would move in parallel.
(A2) No anticipation
No effect before launch: \(Y_{\text{pre}}(1){=}Y_{\text{pre}}(0)\) for the treated. This is what lets a not-yet-treated market stand in as a clean control.
(A3) SUTVA / no interference
One market’s launch doesn’t move another’s revenue — no spillover. In a geo-rollout, the live threat to watch.
Why the double difference works
The estimator is a theorem, not a heuristic — each step licensed by an assumption:
(A2) adds and subtracts the treated group’s pre-period; (A1) swaps its unseen \(Y(0)\) change for the control’s observed one. Consistency turns each \(Y(\cdot)\) into an observable mean — the double difference.
The 2×2 as a regression — repeated cross-sections too
Needs no panel — works on repeated cross-sections (different customers, houses, or visits sampled before and after).
On a panel, unit + period fixed effects absorb \(\alpha{+}\beta D_i\) and \(\gamma t\), collapsing it to \(Y_{it}=\alpha_i+\lambda_t+\tau D_{it}\) — the TWFE form we build on next, whose lone slope is this same \(\tau\).
With one launch date, the 2×2 scales to full dynamics
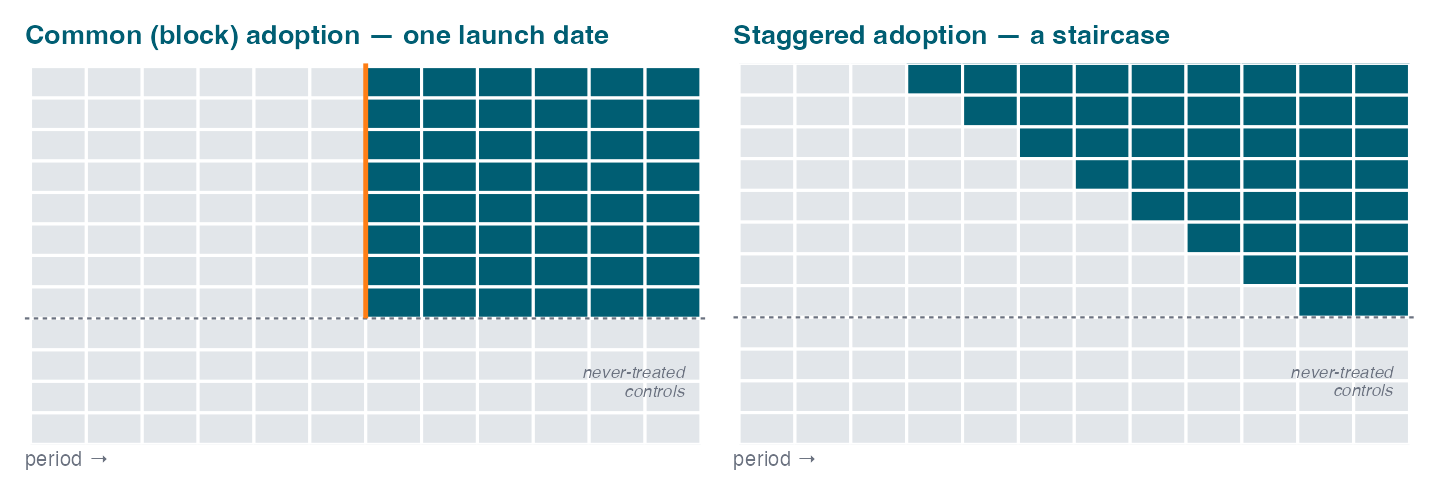
Nothing forces just two periods. If every treated unit launches on the same date (common / block adoption — left), the 2×2 scales up:
Static TWFE stays a clean DiD — one launch date ⇒ no already-treated-as-control comparisons; extra periods just sharpen it.
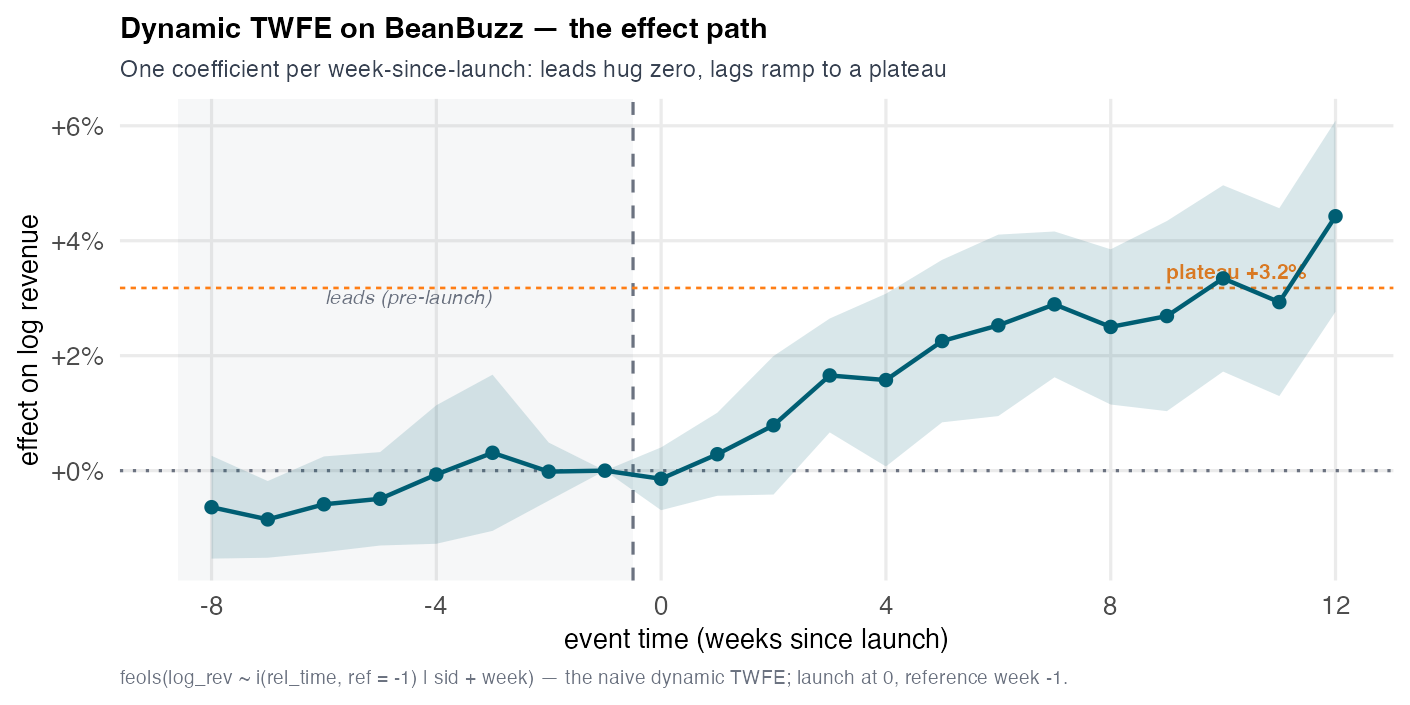
Dynamic TWFE — one coefficient per period-since-launch — traces the effect path (leads ≈ 0, lags = the ramp):
\[Y_{it} = \alpha_i + \lambda_t + \textstyle\sum_{k \neq -1} \beta_k\,\mathbf{1}[\,t - g = k\,] + \varepsilon_{it} \qquad (g\ \text{shared by all treated})\]
The catch: one shared date. Real rollouts stagger it (right) — and that breaks TWFE.
Staggered Adoption
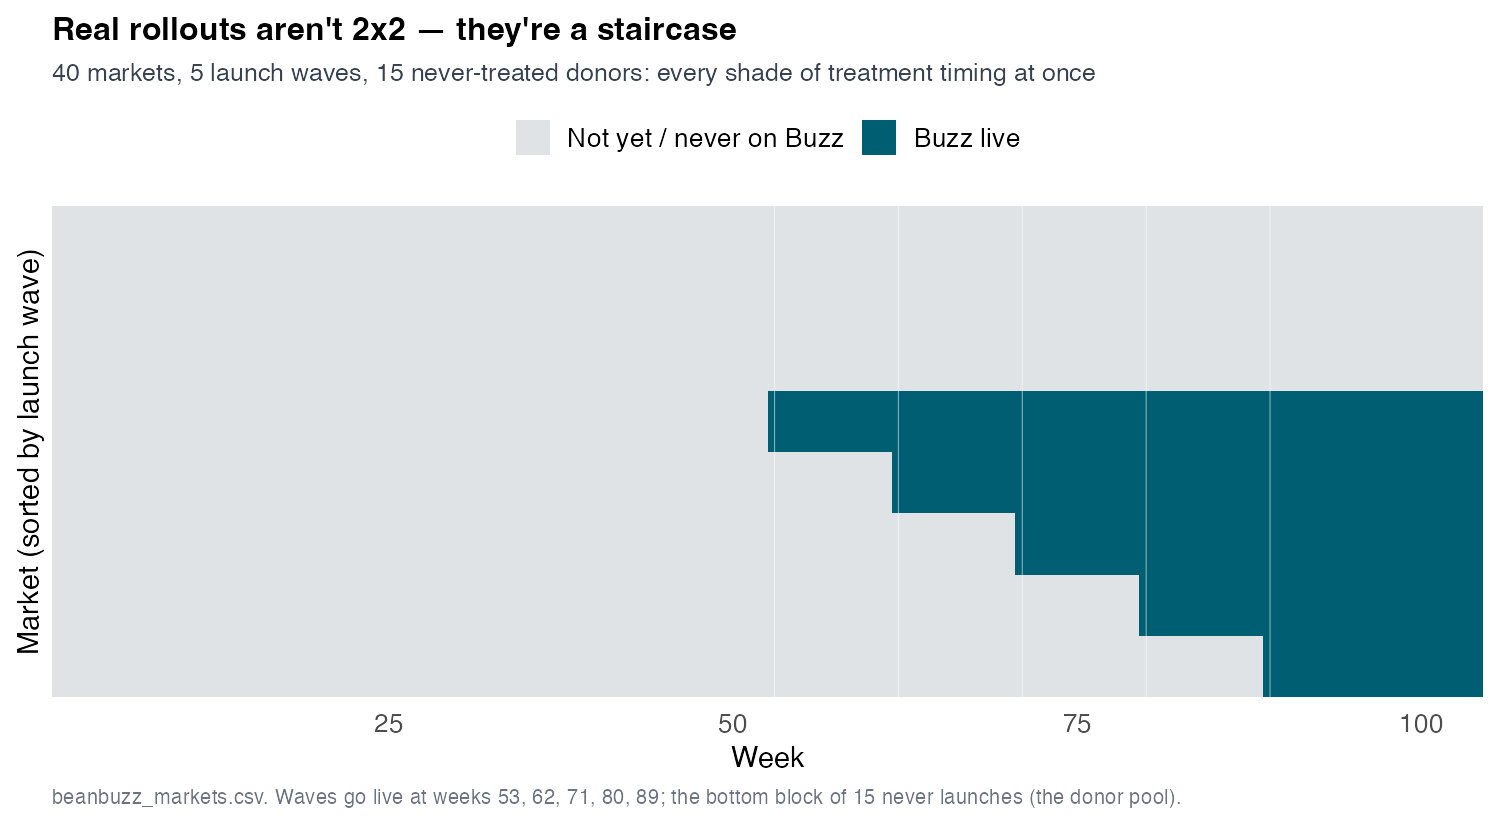
Real rollouts aren’t 2×2 — they’re a staircase
BeanBuzz: 233 stores, 40 markets, 104 weeks. Five launch waves at weeks 53/62/71/80/89, plus 15 never-treated donor markets. Timing varies — the clean 2×2 is gone.
The instinct: throw it all in one TWFE regression
The two-way fixed-effects model — the regression form of the 2×2 arithmetic — now on the full staggered panel:
\(\alpha_i\) — market FE (differences out the level) · \(\lambda_t\) — period FE (differences out common time) · \(\tau\) — the DiD.
With one treated group and two periods, \(\hat\tau\)equals the hand-computed 2×2 exactly. That equivalence is comforting — and, as we’ll see, dangerously misleading once timing varies.
feols(log_rev ~i(treated) | sid + week, data = panel)
It runs. It gives one tidy number:
static TWFE: +3.7%
Much smaller than the naive +16.3% — looks like a sober, corrected estimate. But it is biased, and not in a way you’d guess.
Dynamic TWFE turns one number into the whole path
Swap the single dummy for one per week-since-launch (\(k = t - g_i\), each unit’s own launch \(g_i\)): \[Y_{it} \;=\; \alpha_i + \lambda_t + \textstyle\sum_{k \neq -1}\beta_k\,\mathbf{1}[\,t - g_i = k\,] + \varepsilon_{it}\]
Leads hug zero, lags ramp to a +3.2% plateau — the dynamics static TWFE hid inside one number. But it is the same naive estimator: each lag \(\beta_k\)crushes every cohort into one number per column, so its lags carry forbidden-comparison exposure (the far-horizon drift). Why the column-crush is dirty, and the fix, come next.
TWFE secretly averages every 2×2 it can build
Goodman-Bacon’s result: static TWFE is a variance-weighted average of all the 2×2 DiDs in the panel. (Goodman-Bacon 2021)
Some of those 2×2s are clean:
treated vs never-treated ✓
treated vs not-yet-treated ✓ (the future-treated are valid controls for now)
But to use every period, TWFE also builds a third kind — and that one is poison.
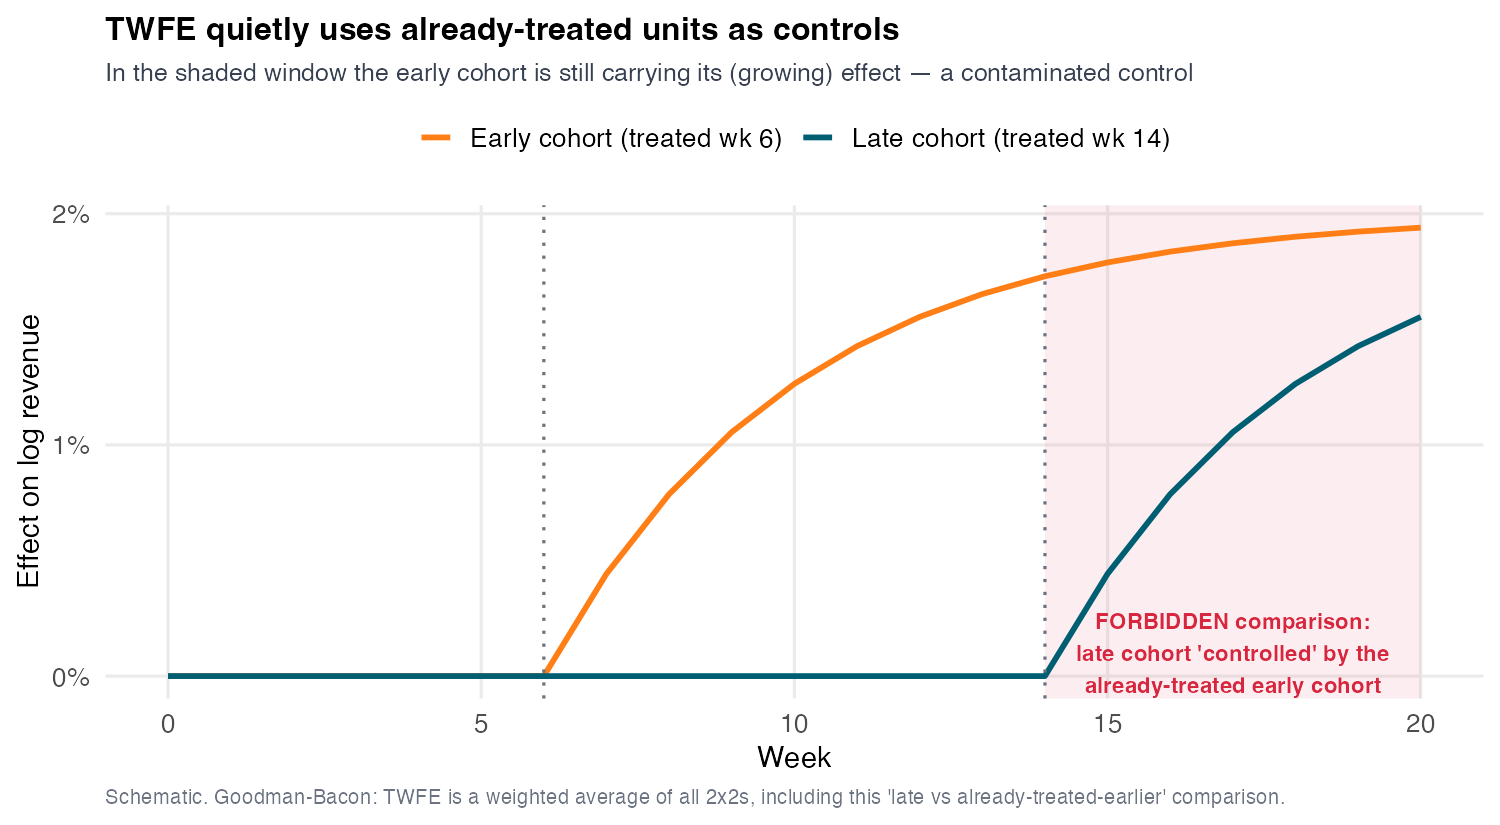
Using the already-treated as controls runs the clock backwards
The forbidden 2×2 uses an already-treated cohort as the control for a later cohort. But the control is still responding to its own treatment — so its change is not pure time. Subtracting it contaminates the estimate.
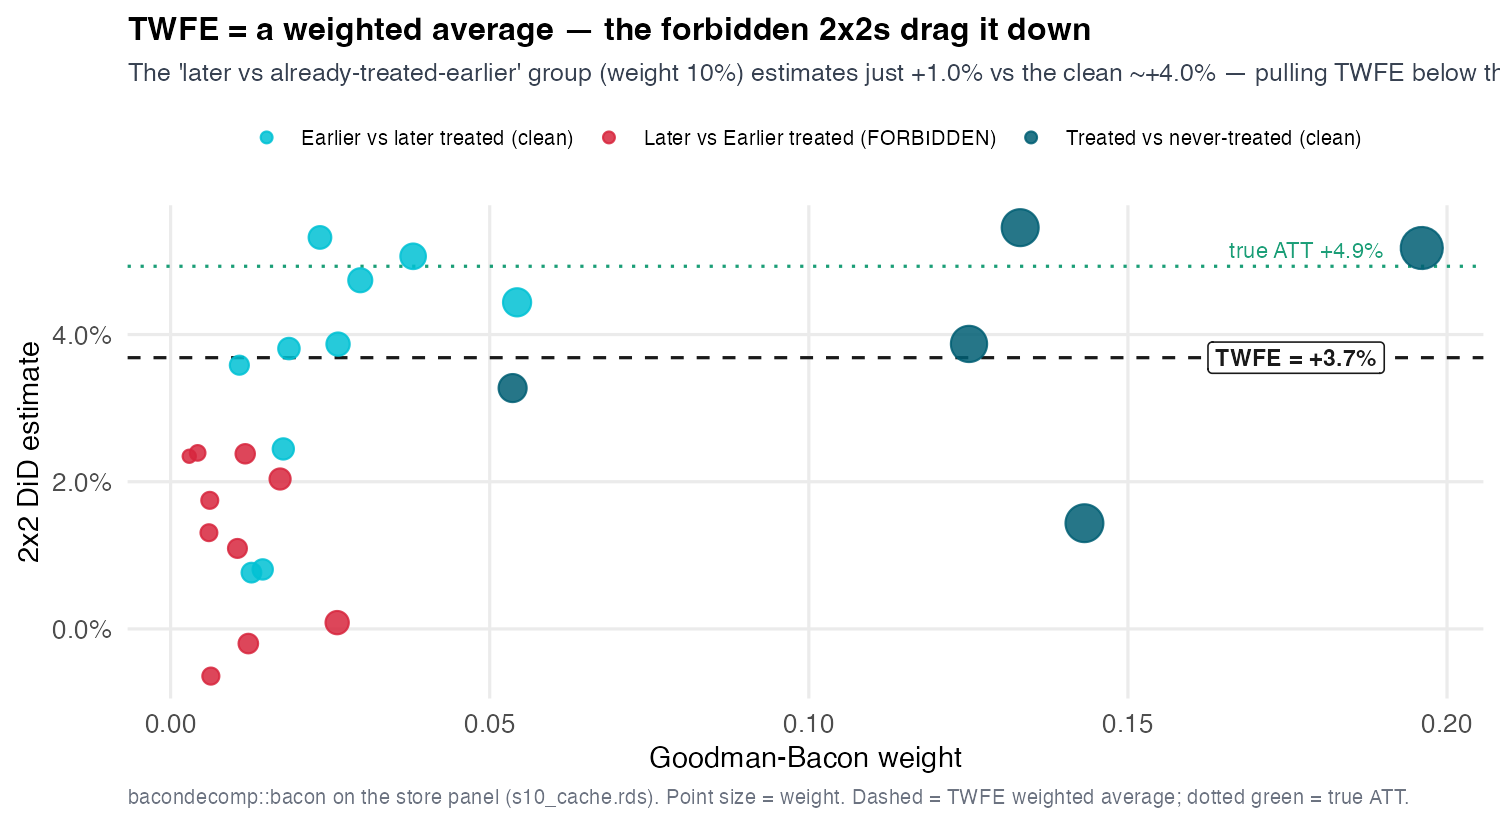
Goodman-Bacon shows where the weight goes
Plot each 2×2’s estimate against its weight. The clean comparisons cluster near +4.0%. The forbidden group sits low — near +1.0% — yet still carries ~10% of the weight.
When effects grow, the forbidden weights turn toxic
The bias is worst exactly when the treatment effect grows over time — as BeanBuzz’s does (it ramps to a plateau).
Here, the forbidden group is attenuated (+1.0% vs the clean +4.0%) and drags TWFE toward zero — the +3.7% is biased downward.
In the general case, de Chaisemartin & D’Haultfœuille show these forbidden comparisons can receive outright negative weights — TWFE can even flip sign. (Chaisemartin and D’Haultfœuille 2020)
A weighted average where some weights are negative is not a treatment effect anyone asked for.
The fix isn’t a better regression — two families, one rule
You cannot patch TWFE with controls or interactions — the problem is which comparisons it forms, not which variables it omits.
The principle that fixes everything
Never use an already-treated unit as a control — compare treated cohorts only to not-yet- or never-treated units. Forward-engineer the comparison; don’t reverse-engineer the regression.(Baker et al. 2025)
Every robust estimator enforces it, splitting into two families by how each builds the clean counterfactual:
Family A — aggregate clean 2×2s: one clean treated-vs-control comparison per cohort, then average. → Callaway-Sant’Anna, Sun-Abraham.
Family B — impute \(Y(0)\): model the untreated potential outcome, predict it for treated cells, average the gaps. → BJS, Gardner.
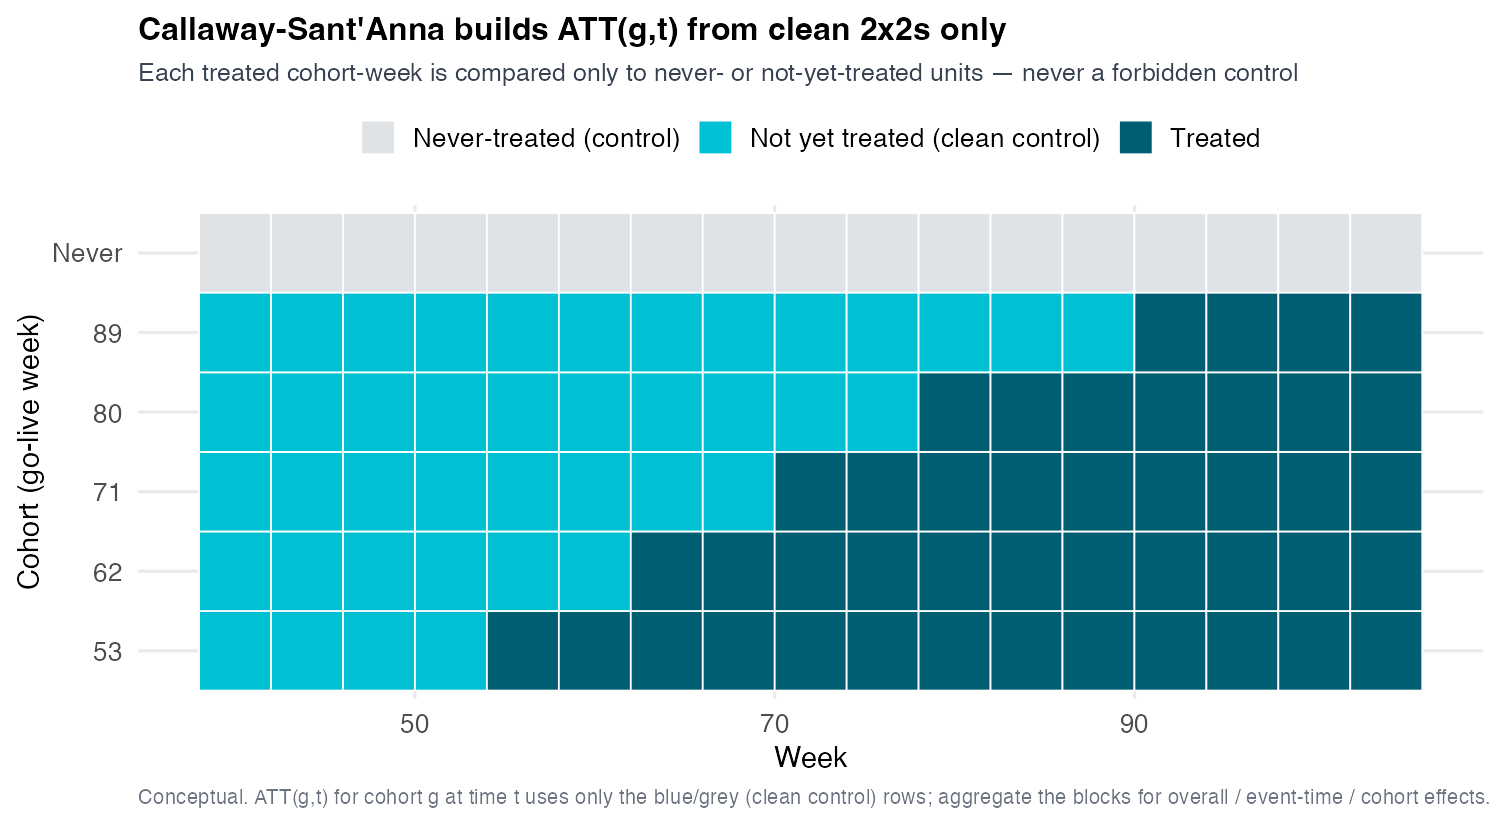
Callaway-Sant’Anna: don’t pool — one clean effect per cohort
Don’t pool. Estimate a group-time ATT — one clean effect per cohort \(g\), period \(t\), \(\text{ATT}(g,t)=\mathbb{E}[Y_t(g)-Y_t(0)\mid G=g]\) — identified as a transparent 2×2: (Callaway and Sant’Anna 2021)
Same blocks, many reports — aggregation is a choice, not a new assumption
Identification happens once, at the block level. Re-weighting is a reporting choice — call aggte(cs, type=…) and read the field; each answers a different question, in a different shape:
Report — aggte() field
In general
For BeanBuzz
Output
Overallgroup$overall.att
The average effect?
App’s worth, all markets?
one number — +3.3%
By cohortgroup$att.egt
Early vs late adopters?
Same gain in every wave?
one per wave — +1% to +5%
By calendar time"calendar"
Does the period matter?
Bigger lift some weeks?
one per week — ≈0% → +5.6%
By relative time"dynamic"
How does it evolve?
Weeks until it matures?
event study — ramp to +3%
Overall and By cohort are the sameaggte("group") call — the overall is just the size-weighted roll-up of the per-wave effects. Disaggregate first, aggregate later.
A separate type=“simple” gives a cruder single overall, +3.5% — it overweights earlier-treated waves (they have more post-periods), so CS report the group roll-up +3.3%.
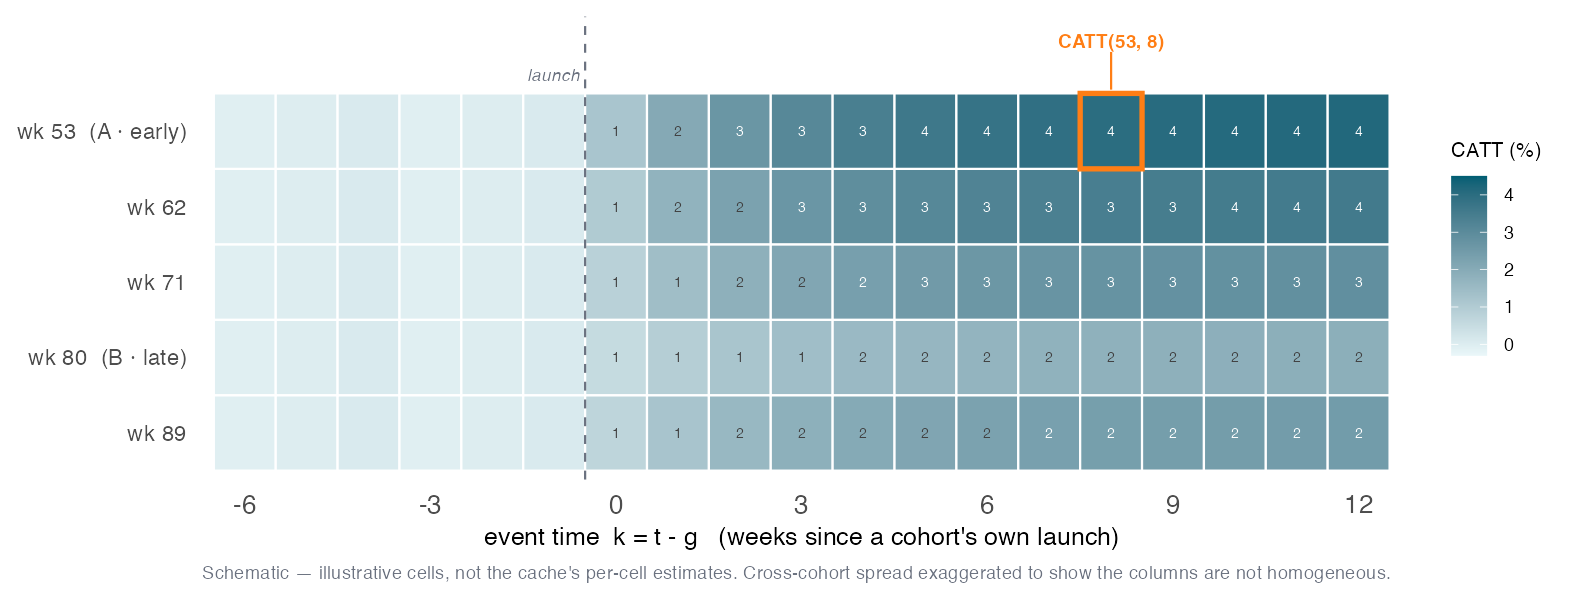
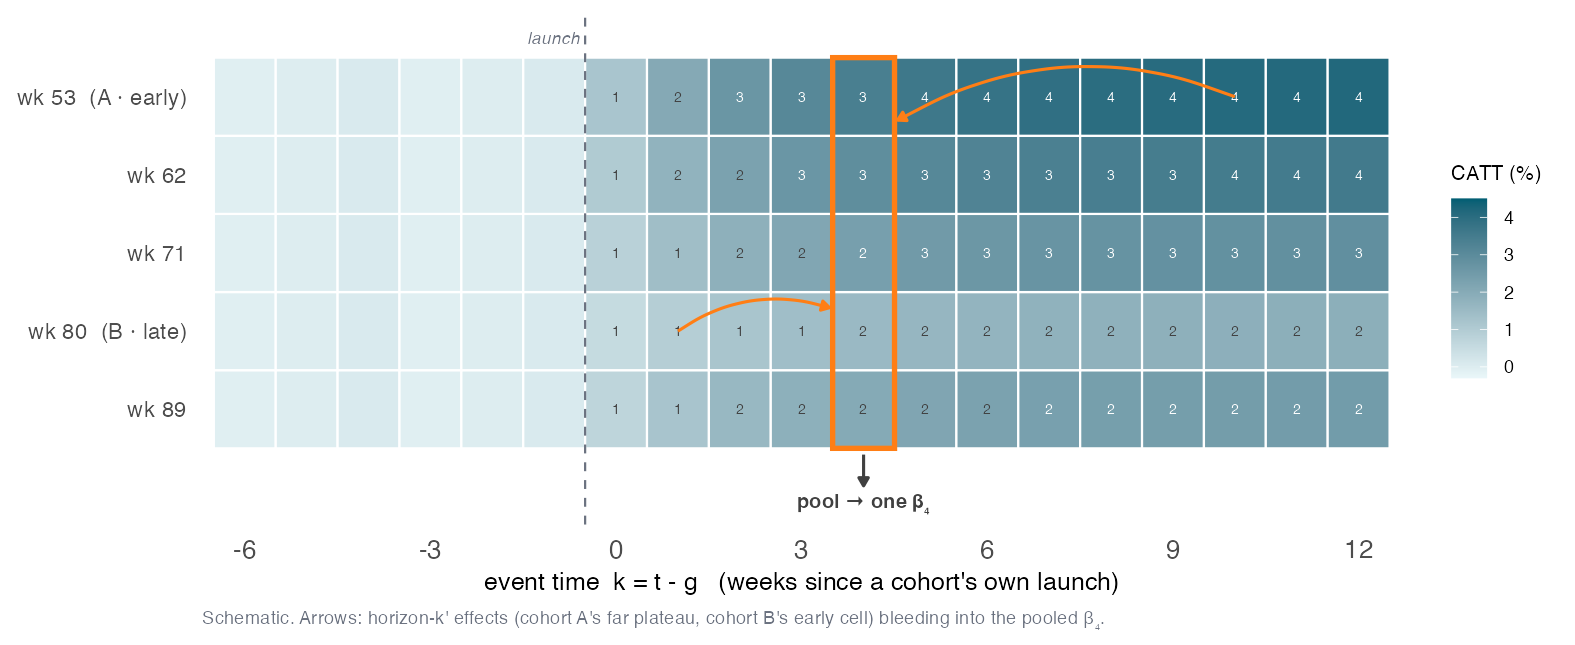
Every estimator reads the same CATT(g,k) grid
Line every cohort up by weeks since its own launch (\(k = t - g\)). One cell is the cohort average treatment effect on the treated — \(\text{CATT}(g,k)\), the number we actually want: (Sun and Abraham 2021)
cohort \(g\)’s average effect \(k\) weeks after its own launch, against the never-treated baseline \(Y(\infty)\)
Set \(t=g+k\) and this is Callaway-Sant’Anna’s ATT\((g,t)\)read in event time — the same estimand, just estimated by a different clean control and fit (non-nested PT), so the cells need not match to the digit.
Naive dynamic TWFE: the column-crush leaks
The naive event study forces one \(\beta_k\) per column, pooling every adoption cohort:
\[\beta_k \;=\; \underbrace{\textstyle\sum_g \omega_{g,k}\,\text{CATT}(g,k)}_{\text{column } k \text{ you wanted}} \;+\; \underbrace{\textstyle\sum_{k'\neq k}\sum_g \omega_{g,k'}\,\text{CATT}(g,k')}_{\text{leak from other columns}}\]
Leak’s cause: cohorts’ effect heterogeneity (\(\text{CATT}(g,k)\) varies with \(g\)); if homogeneous, leak cancels.
Leak’s vehicle: the two-way FE & the other event-time dummies mix cohorts at different maturities.
this sets the weights \(\omega\) — which can become negative → a coefficient sign flip.
leads also affected — a flat naive pre-trend plot is not a clean pre-trends test. (returns later)
Same engine, saturated: cells, not columns
Sun and Abraham (2021) use the same dynamic TWFE engine, but saturate the grid with a cohort \(\times\) event-time interaction on the right-hand side and hold out control cohorts \(C\) (never-/last-treated):
one \(\beta_k\) per event-time column — cohorts pooled
one \(\hat\delta_{g,k}=\widehat{\text{CATT}}(g,k)\) per cell
Control
none held out — \(\beta_k\) leaks other columns (\(\omega\) can be \(<0\))
each cell vs never-/last-treated only — no cross-cohort blend
Identification is done cell-by-cell — re-pooling the clean cells into a report is the last step, next.
Clean cells in, any report out — the same spine as Callaway-Sant’Anna
Identification happened once, at the cell level — each SA coefficient \(\hat\delta_{g,k}\)is a clean \(\widehat{\text{CATT}}(g,k)\) cell. Pooling them back is a reporting choice, the same disaggregate first, aggregate later spine as CS:
SA report
How it pools the clean grid
Output
Event study\(\nu_k\) — iplot(sa)
within each horizon \(k\): cohort-share average across cohorts
ramp to a ~+3% plateau
Overall IW-ATT — summary(sa, agg="att")
one interaction-weighted average over the whole post-grid
\(\text{share}_{g,k}\) = cohort \(g\)’s fraction of the markets observed \(k\) weeks after launch (bigger cohorts count more). These non-negative shares replace OLS’s implicit possibly-negative weights — where the fix lives.
Imputation: fit white, predict grey — at the strongest PT price
BJS(2024) and Gardner(2022) share one idea — model \(Y(0)\) where it is observed, then predict it where it is missing:
market × week panel
never-treated
early cohort
late cohort
week →
observed → fit white missing → predict grey
Fit white — on the observed cells, estimate the additive \(Y_{it}(0)=\alpha_i+\gamma_t+\varepsilon_{it}\).
Predict grey — impute each treated cell’s \(\hat Y_{it}(0)\).
Average the gaps \(\hat\tau_{it}=Y_{it}-\hat Y_{it}(0)\) over grey cells → the ATT.
The price: the strongest PT claim on the menu
The additive \(\alpha_i+\gamma_t\) fit needs every untreated cell to be a valid \(Y(0)\) anchor ⇒ PT across all groups and all periods — the strongest PT claim, stronger than CS/SA’s clean-control PT.
BJS is the efficient imputation — the hinge to S12
Borusyak-Jaravel-Spiess (2024) is the efficient version of the recipe:
It uses all untreated cells — averaging over many pre-periods, not CS’s single base period \(g-1\) → a precision gain.
The per-cell effect \(\hat\tau_{it}\)aggregates any way — overall, by cohort, or into an event study.
Forward to S12
BeanBuzz BJS = +4.2%. S12 re-reads this exact recipe — swapping the additive \(\alpha_i+\gamma_t\) model for a flexible factor / interactive-FE model that can see what DiD’s additive model can’t.
Gardner: the same imputation as two transparent regressions
Gardner’s (2022)did2s writes the identical imputation as two OLS stages:
Stage 1 — on untreated cells only, fit \(Y_{it}(0)=\alpha_i+\gamma_t\); residualize \(Y_{it}-\hat Y_{it}(0)\).
Stage 2 — regress the residual on the treatment dummy \(D_{it}\) (or on event-time dummies for the dynamic path).
Same imputation logic as BJS ⇒ the same point estimate, +4.2% (identical to four decimals) — they differ only in how the standard errors are derived.
Four routes, one estimand — how they relate and differ
Same target, four disciplined ways to reach it — read down each column:
weakest — clean-control PT (chosen never / not-yet)
strongest — PT all groups & periods
Inference
uniform bands
cluster-robust
influence-function SEs
two-stage SEs
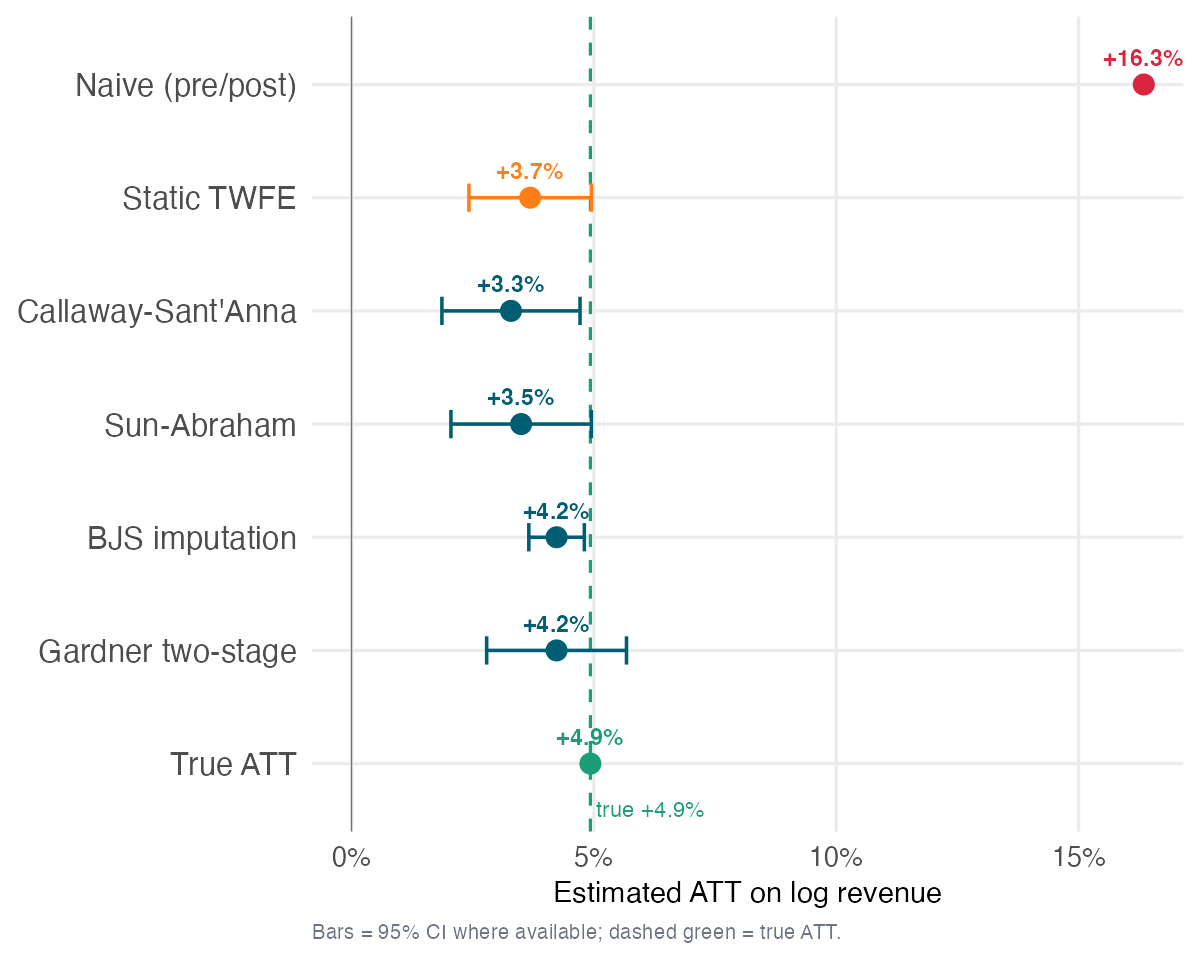
Four estimators converge — just below the truth
One tight band from four different algebras — the spread is weighting / efficiency, not disagreement. Convergence certifies the staggered-timing fix — not identification.
All four share the same additive-PT backbone, so they miss the truth together. That co-miss is the clue:
The gap motivates S11 & S12
An omitted regional-economy factor loads differently on treated vs control markets — a PT violation DiD’s additive model can’t see. S11 (synthetic control) & S12 (counterfactual imputation) are built to.
Conditioning on Covariates
When parallel trends needs a covariate
Sometimes raw parallel trends fails, but a conditional version holds — treated and control move in parallel within strata of covariates \(\mathbf{X}\). Conditioning switches on two assumptions raw DiD never needed:
(A.cpt) Conditional parallel trends
\(\mathbb{E}[\Delta Y(0)\mid D{=}1,\mathbf{X}] = \mathbb{E}[\Delta Y(0)\mid D{=}0,\mathbf{X}]\) — with \(\mathbf{X}\)not affected by treatment.
(A.cna) Conditionally no anticipation
No pre-launch effect within each \(\mathbf{X}\)-stratum — the treated and control paths coincide before \(g\) given \(\mathbf{X}\).
(A.pos) Overlap / positivity
Every treated \(\mathbf{X}\) has a control that shares it: \(0 < \Pr(D{=}1\mid\mathbf{X}) < 1\). Watch this one — on BeanBuzz it breaks.
Which covariates actually confound a trend?
Two axes decide it: is the covariate fixed or moving, and is its effect on \(Y\) fixed or moving?
A fixed \(X_i\) added additively is collinear with \(\alpha_i\) → silently dropped. It only adjusts through a time-varying channel — \(X_i\times t\), or a differenced-outcome model. Ask: does \(X\) move the trend, or just the level?
Selection alone is not confounding
A covariate can also predict who gets treated (\(X\to D\)) — but that alone does not bias DiD: differencing absorbs fixed levels, so DiD tolerates selection on time-invariant traits. It bites only if the selector also moves the trend (but conditioning on a strong selection driver can break overlap).
Time-varying \(X\): pin it at pre-treatment — or model it
Most estimators treat every covariate as time-invariant — a moving \(X_{it}\) is fixed at its pre-launch value:
Why: a post-launch \(X_{it}\) the app changed is a mediator — a bad control (next slide). Fixing it also cuts dimensionality.
Cost: you no longer control a genuinely different evolution in \(X_{it}\) — that PT violation survives.
If \(X_{it}\) is exogenous to treatment (given its past): a doubly-robust estimator may use its post-treatment values, or you regression-impute the counterfactual \(X_{it}(0)\). (Caetano et al. 2024)
On BeanBuzz the four adjustment covariates are all time-invariant — this rung is the theory you’d need if they weren’t.
Which covariates? The bad-control trap
More covariates is not safer. A covariate the treatment affects is a bad control:
Mediators / post-treatment covariates — conditioning on them subtracts part of the effect (over-control). (Caetano et al. 2024)
The “kitchen-sink” TWFE — throwing in every \(X_{it}\) — can bias the estimate, not clean it.
Rule: condition only on pre-treatment characteristics that could confound the trend — never on a consequence of the app. (Assignment V makes you make exactly this call.)
Where \(X\) enters TWFE and Sun-Abraham
Both are one feols regression, so \(X\) enters as the same hand-written term — only the treatment block differs (\(\tau(D_i{\times}t)\) or i(rel,ref=-1) for TWFE, sunab(g,week) for Sun-Abraham). Pick the covariate × effect combination (Zeldow and Hatfield 2021):
covariate × effect
cov term
fixest
fixed \(X_i\) × time-varying effect
\(\delta\,(X_i\times t)\)
+ i(week, X)
moving \(X_{it}\) × fixed effect
\(\delta\,X_{it}\)
+ X
moving \(X_{it}\) × time-varying effect
\(\delta\,(X_{it}\times t)\)
+ i(week, X)
The covariate block is identical for the event study and for Sun-Abraham — only the treatment block beside it changes.
The shared price (Caetano-Callaway)
Homogeneous-in-\(X\), linear-in-\(X\), adjusts changes not levels. Difference: on TWFE it can’t fix the staggered-timing bias (decorates a biased estimator); on SA it rides an already-clean one. (Caetano et al. 2024)
Callaway–Sant’Anna’s doubly-robust model on \(\Delta Y\)
C&S’s default (est_method="dr") puts \(X\) into two nuisance models on the change \(\Delta Y = Y_t - Y_{g-1}\) (\(\alpha_i\) differenced out) (Sant’Anna and Zhao 2020):
Outcome\(\;\hat m_0(\mathbf X)=\mathbb E[\Delta Y\mid D{=}0,\mathbf X]\) — the control group’s expected change given \(\mathbf X\), imputed onto the treated.
Propensity\(\;\hat e(\mathbf X)=\Pr(D{=}1\mid\mathbf X)\) — reweight controls to the treated’s \(\mathbf X\)-mix.
needs period-specific \(X\) → base-period coercion on a balanced panel
Two chances to be right: consistent if either\(\hat m_0\)or\(\hat e\) is right. Neyman-orthogonal, so fit both nuisances with ML — S09’s AIPW score = Chang’s DML-DiD. (Chang 2020)
BJS / Gardner: covariates in the \(Y(0)\) imputation
\[\underbrace{Y_{it}(0)=\alpha_i+\gamma_t+\delta\,(X_i{\times}t)+\varepsilon_{it}}_{\text{fit on untreated cells (the first stage)}}\ \longrightarrow\ \hat Y_{it}(0),\qquad \hat\tau_{it}=Y_{it}-\hat Y_{it}(0)\]
\(X\) enters the first_stage via the same three specs as TWFE/SA — \(X_i{\times}t\) · \(X_{it}\) · \(X_{it}{\times}t\). BJS = Gardner (identical entry; differ only in SE).
No propensity → no overlap needed (unlike CS-IPW/DR); but OR-family, so not doubly robust.
You can even impute \(X(0)\)
A time-varying \(X_{it}\) the treatment moved is a bad control. Instead impute its counterfactual \(X_{it}(0)\) on the untreated cells (same recipe), then feed \(X_{it}(0)\) into the \(Y(0)\) model — imputation extends to the covariate. (Caetano et al. 2024)
Seven candidate covariates: could confound vs. what they do
A covariate confounds only if it moves the trend and lines up with the biggest-first rollout — via one of the three specs. Here, most don’t:
Covariate
type
Would confound if… → which spec
In BeanBuzz it…
market_size
inv
big markets ride a size-scaled trend → (i)\(X_i{\times}t\)
urban markets swing harder with seasonality → (i)\(X_i{\times}t\)
the real \(X{\times}t\) channel — loads the seasonal factor (\(+3.5\%\) row)
seats
inv
more seats bite harder as demand surges → (i)\(X_i{\times}t\)
decoy — not in revenue
competitor_density
inv
denser markets feel a growing competitive drag → (i)\(X_i{\times}t\)
decoy — not in revenue
footfall_index
var
an urban revival lifts treated footfall → (ii)\(X_{it}\)
decoy — a proxy of the common seasonality
temp_c
var
different climates × temp-sensitive demand → (ii)\(X_{it}\)
decoy — a common wave, absorbed by \(\gamma_t\)
mktg_spend
var
a size-scaled ad push over the window → (ii)\(X_{it}\)
bad control — jumps at launch (treatment-affected)
Only urban_share moves the trend (an observed seasonal loading); market_size drives selection; the rest are decoys — and mktg_spend is a consequence of the app.
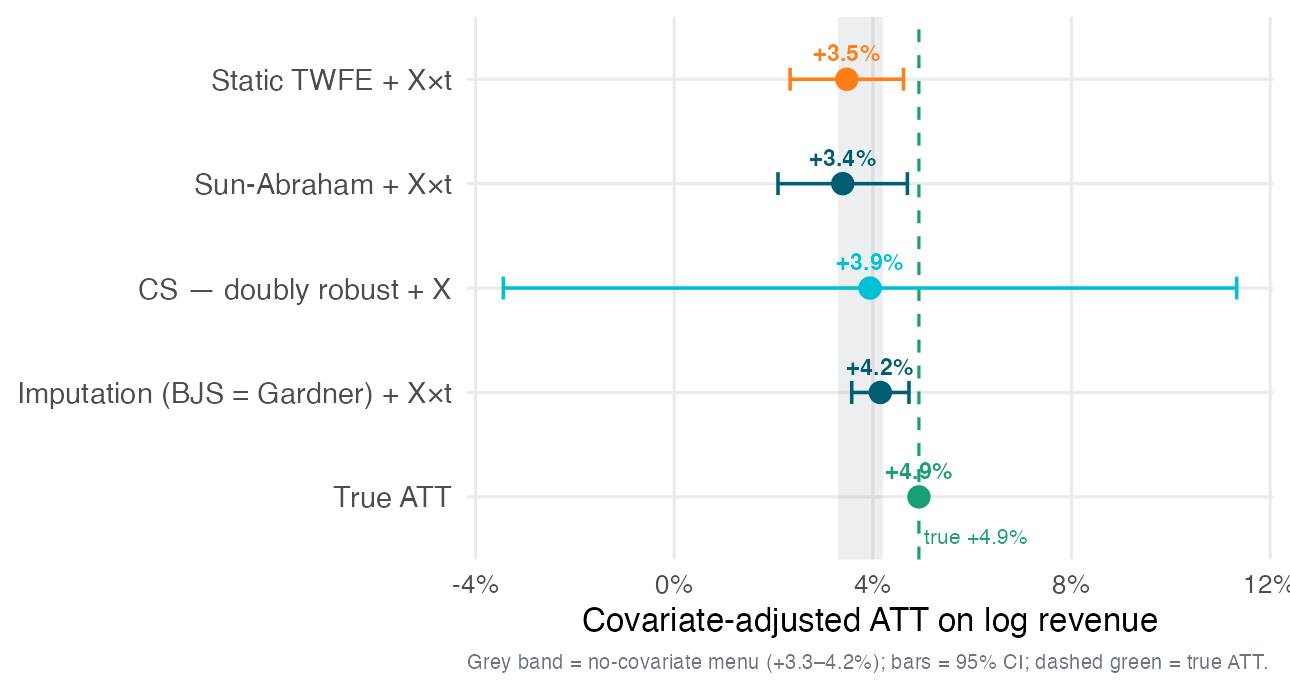
The covariate forest: \(X\) rescues none of them
Condition each estimator its own way — still the +3–4% band, below truth:
Covariates are not the fix
The band neither tightens nor reaches +4.9%; conditioning on size breaks overlap (C&S-DR’s CI explodes). The residual is a latent factor no \(X\) proxies → S11 / S12.
Parallel Trends
Parallel trends is untestable — we escalate
Our headline +3.29% (Callaway-Sant’Anna) rests entirely on one assumption we can never check directly.
The untestable core
Parallel trends concerns the treated markets’ revenue had they never launched — a path that unfolds after launch and is never observed. A flat pre-trend is circumstantial evidence, never proof.
Our only visual test — the flat pre-trend — has three blind spots:
Low power — a slow drift the pre-test rarely catches
Wrong window — pre-flatness says nothing about a divergence that opens only post-launch
Conditioning bias — keeping a study only when pre-trends “pass” selects on noise
Three tools of accelerating rigor close the blind spots: (i) the pre-trend eyeball (what we repair) → (ii) pretrends powerquantifies low power (Roth 2022) → (iii) HonestDiD answers wrong-window + conditioning, subsuming the pre-test (Rambachan and Roth 2023).
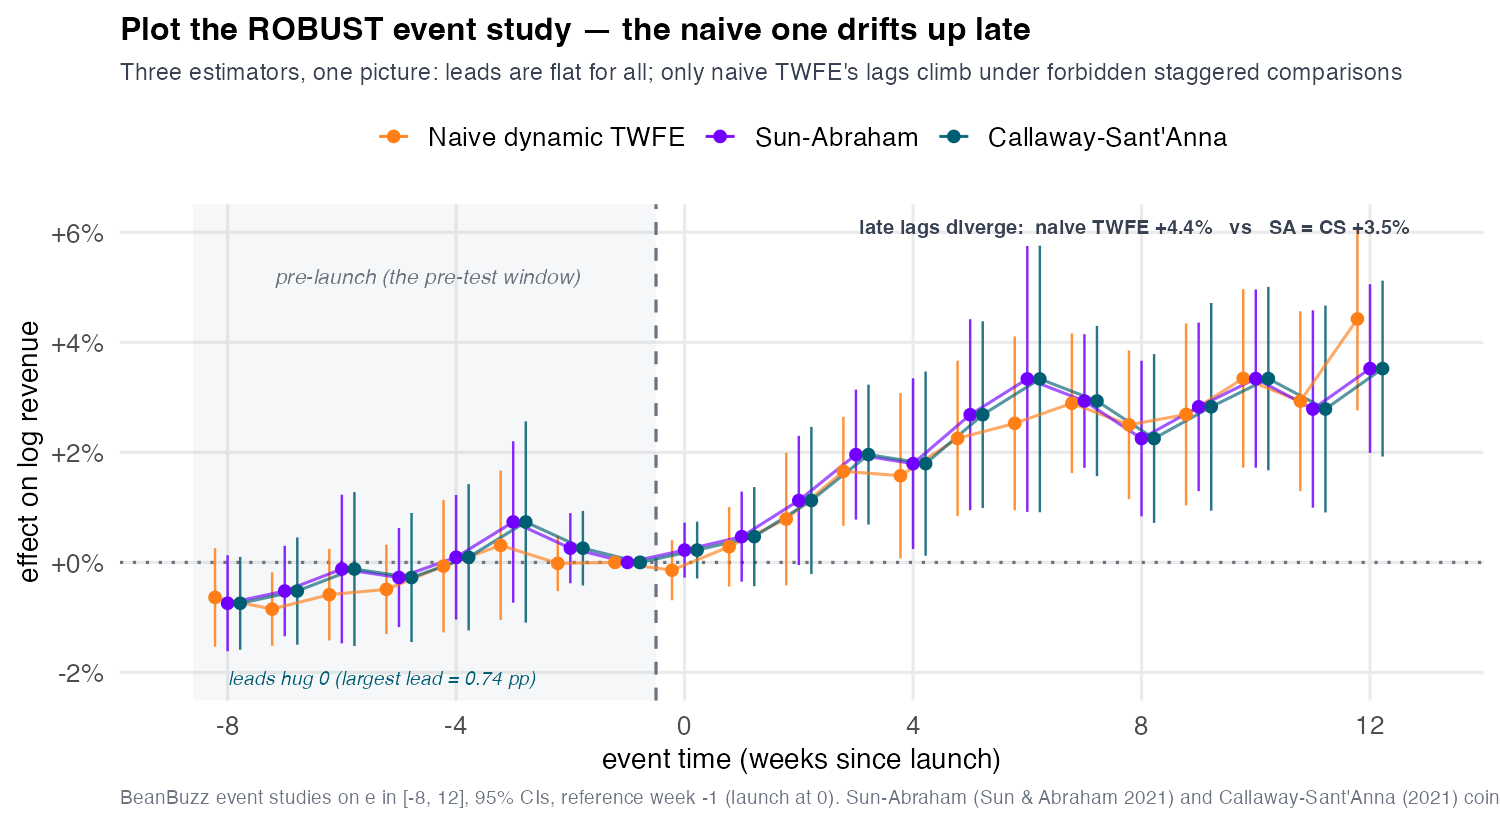
Trust the robust estimators, not the naive lags
Leads (the pre-trend test) hug zero — largest 0.74 pp, none significant.
Lags plateau at +2.95%; Sun-Abraham and CS coincide — only naive TWFE drifts up to +4.43%, forbidden-comparison contamination made visible.
Two recommendations
(1) What to read — the robust estimators, Callaway-Sant’Anna or Sun-Abraham (Sun and Abraham 2021); never the naive dynamic TWFE lags. (2) Base period — set base_period="universal" (hold \(e=-1\)): robust estimators build pre/post coefficients asymmetrically, so a default plot can fake a kink at zero(Roth 2024).
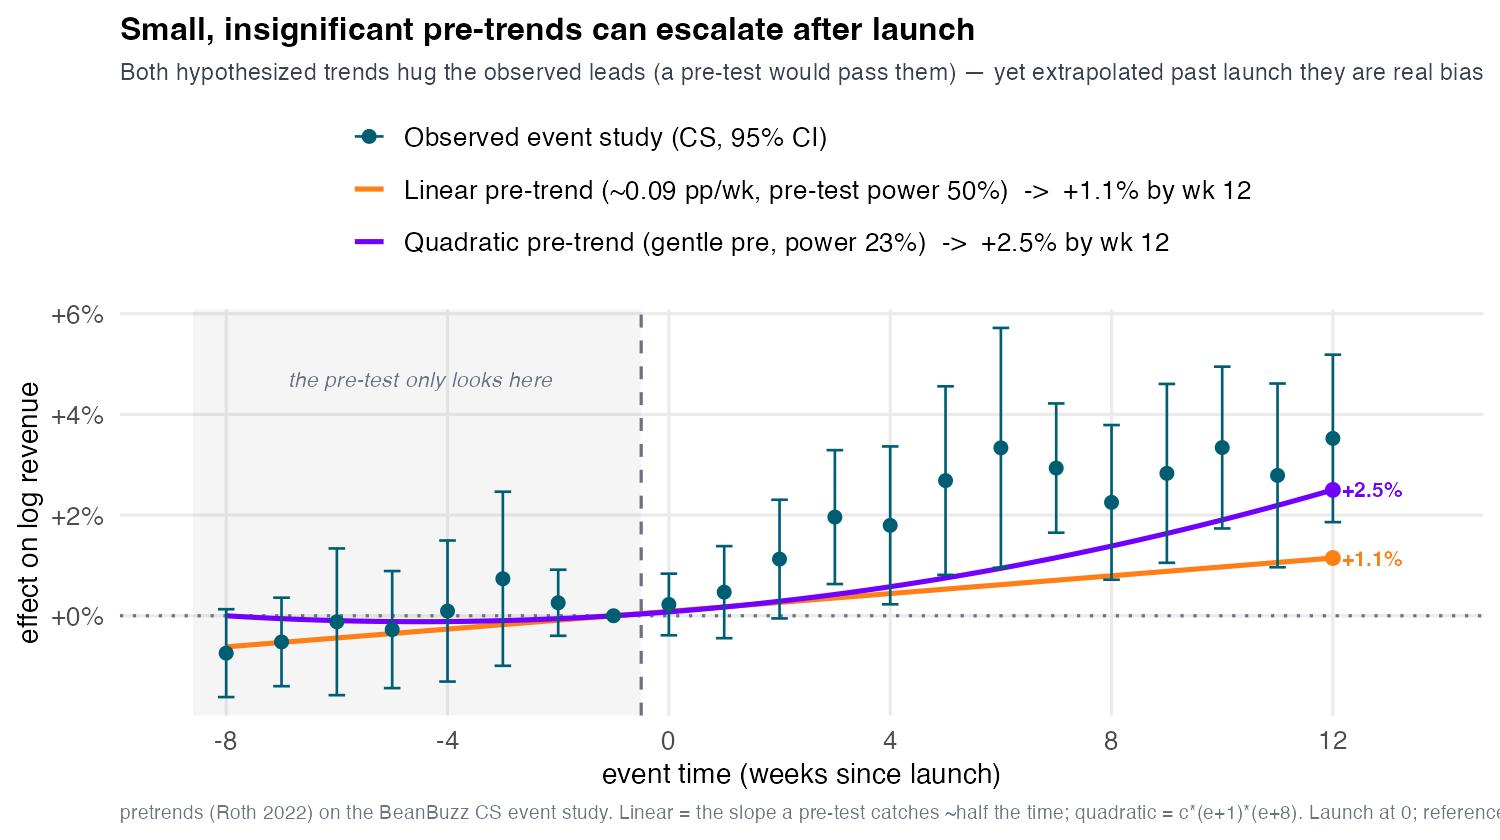
A biasing trend can hide in a flat pre-period
Blind spot (1) — low power, formalized. The pre-test jointly tests all leads = 0, so “passing” is only fail-to-reject, never confirm. slope_for_power() inverts it — the trend the test catches only a set fraction of the time; its bias is that trend extrapolated across the post window. (Roth 2022)
Both curves sit inside the leads’ error bars — a pre-test would pass them — yet grow after launch into real bias against a ~+3.5% effect:
Linear 0.088 pp/week — caught only ~50% of the time → +1.15% by week 12.
Quadratic(a convex path shaped to stay insignificant pre-launch) — caught only ~23% of the time → +2.5% by week 12.
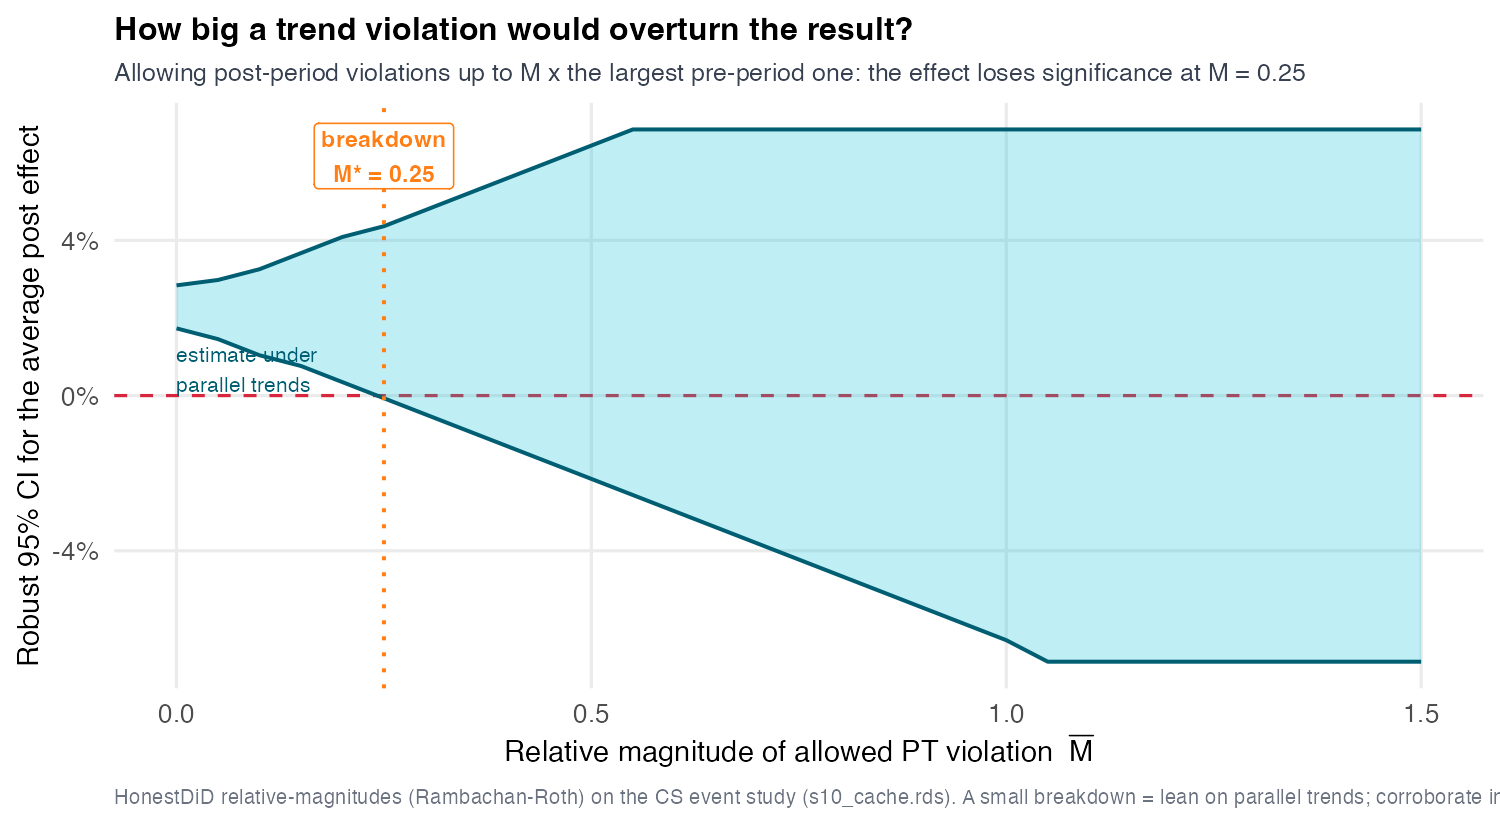
How big a violation before the effect breaks?
From pass/fail gate to yardstick
Stop asking “did the pre-trend pass?” Bound the unseen post-launch violation at \(\bar M \times\) the worst observed pre-period wobble; each \(\bar M\) yields an identified set and a confidence interval. The breakdown\(\bar M^{*}\) is the smallest \(\bar M\) whose CI first includes 0 (large → robust, small → fragile). This bounds the wrong-window violation the pre-test never saw, and replaces conditioning on a pass with the whole curve. (Rambachan and Roth 2023)
Name the object. The sweep stress-tests the +2.25% average post-launch effect (mean of the dynamic lags, weeks 0–12) — a more conservative aggregation than the +3.29% cohort-weighted headline. Robust CI runs [+1.73%, +2.84%] at \(\bar M=0\) → [−0.07%, +4.36%] at breakdown \(\bar M^{*} = 0.25\).
BeanBuzz: clear under parallel trends, only moderately robust
Read \(\bar M^{*} =\) 0.25: a violation just a quarter as large as the worst pre-period wobble already overturns the average effect — the bias compounds over the horizon, so a drift invisible week-to-week accumulates across the plateau.
The honest verdict
The average post-launch effect is statistically CLEAR under parallel trends, but only MODERATELY robust to violations of it — not bulletproof. Because \(\bar M^{*} = 0.25 < 1\), we do not claim the effect survives violations as large as — let alone larger than — the worst we observed. The +3.29% headline leans on the same assumption; it is not separately shielded.
The Part V discipline — the same honesty as S09’s “is it real?”
A point estimate without a sensitivity analysis is not a finding.(Identify → impute → report a band + breakdown.)
Next (S11): corroborate with synthetic control — a method that does not lean on parallel trends.
Baker, Andrew C., Brantly Callaway, Scott Cunningham, Andrew Goodman-Bacon, and Pedro H. C. Sant’Anna. 2025. “Difference-in-Differences: A Practitioner’s Guide.”arXiv Preprint arXiv:2503.13323.
Borusyak, Kirill, Xavier Jaravel, and Jann Spiess. 2024. “Revisiting Event-Study Designs: Robust and Efficient Estimation.”Review of Economic Studies 91 (6): 3253–85. https://doi.org/10.1093/restud/rdae007.
Caetano, Carolina, Brantly Callaway, Stroud Payne, and Hugo Sant’Anna Rodrigues. 2024. “Difference in Differences with Time-Varying Covariates.”https://doi.org/10.48550/arXiv.2202.02903.
Callaway, Brantly, and Pedro H. C. Sant’Anna. 2021. “Difference-in-Differences with Multiple Time Periods.”Journal of Econometrics 225 (2): 200–230. https://doi.org/10.1016/j.jeconom.2020.12.001.
Chaisemartin, Clément de, and Xavier D’Haultfœuille. 2020. “Two-Way Fixed Effects Estimators with Heterogeneous Treatment Effects.”American Economic Review 110 (9): 2964–96. https://doi.org/10.1257/aer.20181169.
Rambachan, Ashesh, and Jonathan Roth. 2023. “A More Credible Approach to Parallel Trends.”Review of Economic Studies 90 (5): 2555–91. https://doi.org/10.1093/restud/rdad018.
Roth, Jonathan. 2022. “Pretest with Caution: Event-Study Estimates After Testing for Parallel Trends.”American Economic Review: Insights 4 (3): 305–22. https://doi.org/10.1257/aeri.20210236.
———. 2024. “Interpreting Event-Studies from Recent Difference-in-Differences Methods.”arXiv Preprint arXiv:2401.12309.
Sant’Anna, Pedro H. C., and Jun Zhao. 2020. “Doubly Robust Difference-in-Differences Estimators.”Journal of Econometrics 219 (1): 101–22. https://doi.org/10.1016/j.jeconom.2020.06.003.
Sun, Liyang, and Sarah Abraham. 2021. “Estimating Dynamic Treatment Effects in Event Studies with Heterogeneous Treatment Effects.”Journal of Econometrics 225 (2): 175–99. https://doi.org/10.1016/j.jeconom.2020.09.006.
Zeldow, Bret, and Laura A. Hatfield. 2021. “Confounding and Regression Adjustment in Difference-in-Differences Studies.”Health Services Research 56 (5): 932–41. https://doi.org/10.1111/1475-6773.13666.