9. Treatment Effect Heterogeneity
Causal Data Science for Business Analytics
Hamburg University of Technology
Monday, 22. June 2026
Last week DML handed you one number: the average effect, with an honest interval.
But “on average the coupon adds €1.50” is the answer to a question a manager rarely asks.
The real question is whom should we send it to?
The ATE told you whether — not for whom
S08 closed with an ATE for the coupon: a tidy point with a \(\sqrt{n}\) interval. Useful — but it hides three managerial questions:
- Understand — who responds, and by how much? (\(\tau(x)\))
- Validate — is the variation real, or did a flexible model invent it?
- Act — given \(\tau(x)\), whom do we actually treat? (\(\pi(X)\))
The S08 → S09 move, in one line
S08 averaged the per-unit score \(\psi_i\) into the ATE. S09 projects \(\psi_i\) on covariates. Stop averaging the score — start projecting it on \(X\).
One score powers every method today
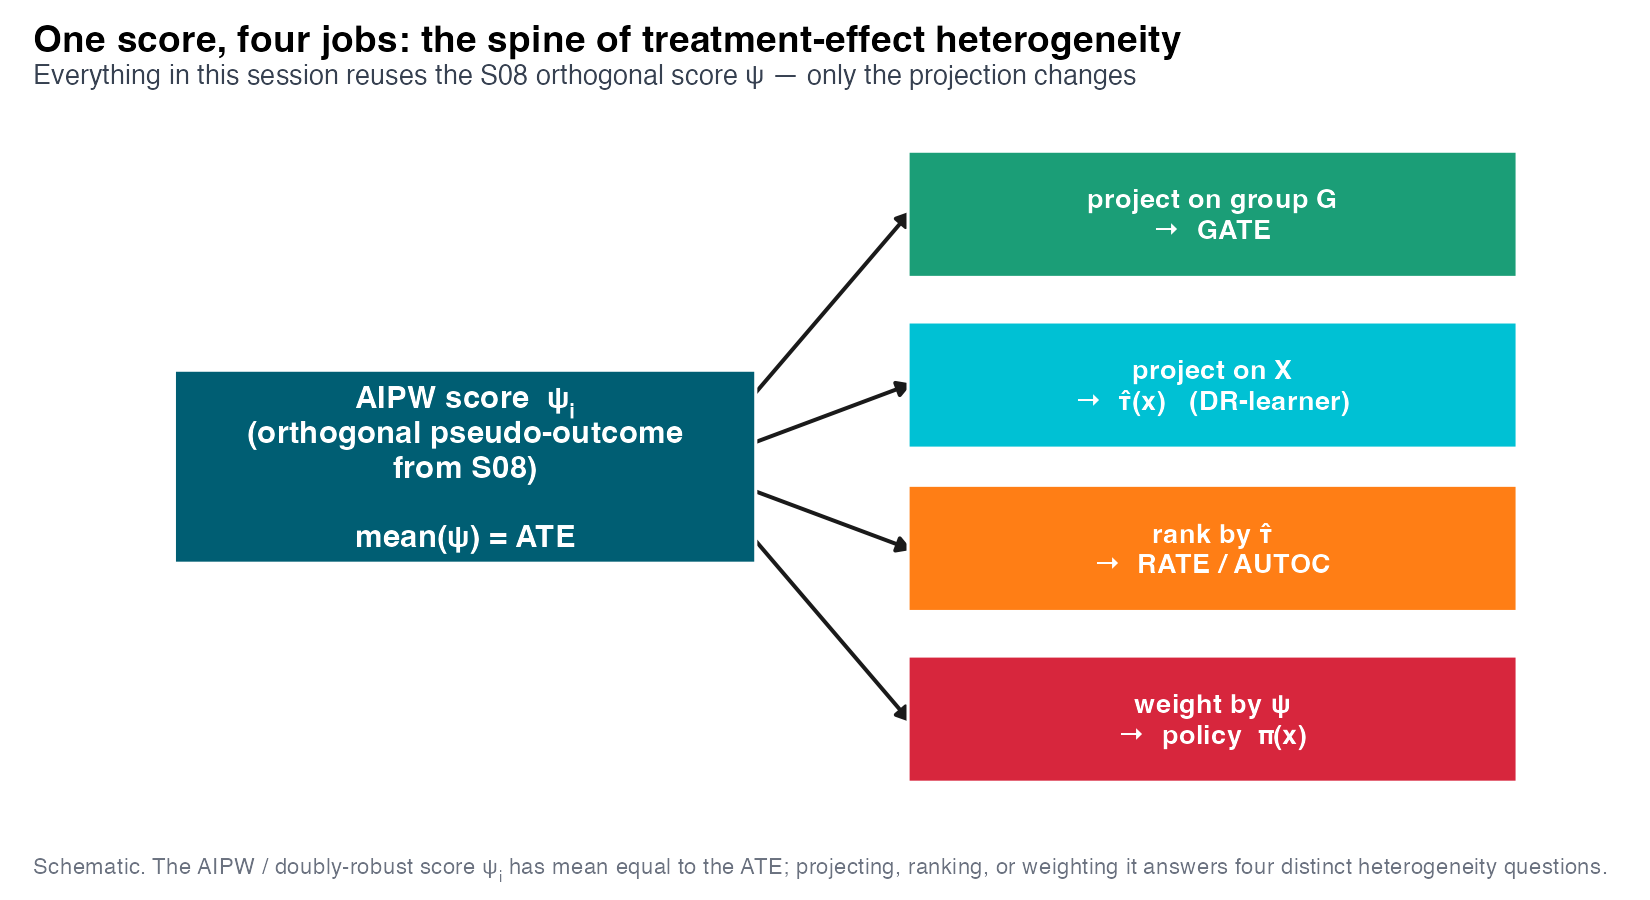
One object — the per-unit score \(\psi_i\) — powers everything today. Average it → ATE. Project / rank / weight it → GATE, \(\tau(x)\), RATE, policy.
When the Average Lies: Let the Effect Vary
On ShopSphere, the average effect is a trap
| Symbol | ShopSphere | Role |
| \(D\) |
coupon (0/1)
|
targeted discount |
| \(Y\) |
profit_30d (€)
|
30-day profit |
| \(X\) | recency, frequency, monetary, tenure, age, channel, email opens, loyalty | customer covariates |
A naive treated-minus-control difference says the coupon destroys profit: −€1.38. But the firm sends coupons to lapsing customers — who would have spent less anyway. The sign is confounded.
De-confounded, the average is real — but boring
Run the S08 AIPW estimator (cross-fitted \(\hat\mu_1,\hat\mu_0,\hat e\)) and the sign flips:
| Estimator | Effect (€) | Verdict |
| Naive difference | −1.38 | sign-flipped by confounding |
| Linear OLS (controls) | 1.65 | closer, still parametric |
| AIPW (DML) | ≈ 1.5 | CI covers truth (1.69) |
So the coupon adds about €1.5 on average — “meh”. A blanket campaign barely breaks even. The average hides the action.
The object we want: the conditional effect \(\tau(x)\)
Define the conditional average treatment effect — the effect for customers like \(x\):
\[\tau(x) \;=\; \mathbb{E}\!\left[\,Y(1) - Y(0) \;\middle|\; X = x\,\right]\]
- ATE \(=\mathbb{E}[\tau(X)]\) — one number for the whole population (S08).
- CATE / IATE \(=\tau(x)\) — a function of the customer (today).
- GATE \(=\mathbb{E}[\tau(X)\mid G]\) — the effect for a named group (a coarsening of \(\tau(x)\)).
Same potential-outcome contrast as the ATE — just not averaged away. The ATE is \(\tau(x)\) collapsed to a point.
Heterogeneity needs no new identification
A natural worry: does conditioning on \(x\) require more assumptions? No.
By the law of iterated expectations, the ATE is just the average of the inner effects:
\[\text{ATE} \;=\; \mathbb{E}\big[\,\tau(X)\,\big] \;=\; \mathbb{E}\big[\,\mathbb{E}[Y(1)-Y(0)\mid X]\,\big]\]
If unconfoundedness \(\{Y(1),Y(0)\}\perp D \mid X\) identifies the outer average, it already identifies the inner effect \(\tau(x)\) — the same assumption, not yet averaged.
The reassurance
Heterogeneity is an estimation challenge (a function is harder than a number), not an identification one. The S08 assumptions carry over verbatim.
Two roles for a covariate: confounder vs effect-modifier
A variable in \(X\) can play two distinct roles — and they are independent:
| Role | What it affects | If ignored… |
| Confounder \(C\) | both \(D\) and \(Y\) | bias — must adjust (identification) |
| Effect-modifier \(H\) | the size of \(\tau(x)\) | you miss heterogeneity (description) |
A variable can be both, either, or neither. On ShopSphere frequency is both: it drives who gets a coupon (confounder) and how much the coupon helps (modifier).
Crucial: you condition on \(C\) to remove bias; you condition on \(H\) to describe variation. Different jobs, often the same columns.
IATE or GATE? A bias–variance choice
How finely should we resolve the effect? It is a bias–variance trade-off:
- IATE / \(\tau(x)\) — maximal resolution. Low bias, high variance: each \(x\) has little data, so individual estimates are noisy and hard to trust.
- GATE — coarse groups (e.g. frequency bands). Higher bias (averages within group), low variance: lots of data per cell, valid inference.
A useful division of labour
GATE is what you report (stable, interpretable, defensible SEs). \(\tau(x)\) is the engine that ranks and targets — even when no single \(\tau(\hat x)\) is individually precise.
The score whose expectation IS the effect
Recall the S08 AIPW pseudo-outcome — the per-unit doubly-robust signal:
\[\psi_i = \big[\hat\mu_1(X_i) - \hat\mu_0(X_i)\big] + \frac{D_i\,(Y_i-\hat\mu_1(X_i))}{\hat e(X_i)} - \frac{(1-D_i)(Y_i-\hat\mu_0(X_i))}{1-\hat e(X_i)}\]
Its defining property — the spine of the whole session:
\[\boxed{\;\mathbb{E}\big[\psi \mid X = x\big] \;=\; \tau(x)\;}\]
So \(\psi_i\) is a noisy unbiased label for the unseen \(\tau(X_i)\). Averaging it gave the ATE; regressing it on \(X\) gives \(\tau(x)\). Every method today is a different regression of \(\psi\).
The roadmap: understand, validate, act
- Understand — estimate \(\tau(x)\): GATE (Act 2), then causal forests & meta-learners (Act 3).
- Validate — is the heterogeneity real? BLP test + RATE/TOC targeting curve (Act 4).
- Act — turn \(\tau(x)\) into a deployable rule \(\pi(X)\): policy learning & policy trees (Act 5).
The discipline that makes this trustworthy: a flexible learner will always hand you a wiggly \(\hat\tau(x)\) — even from pure noise. Estimation is easy; earning belief in the estimate is the work.
Report the Group Effect: GATE from the Score
Stratify first — the honest, coarse view
The simplest heterogeneity analysis: split customers into pre-specified groups and estimate the effect within each.
- Pick a small number of policy-relevant groups (frequency bands, channels, loyalty tiers).
- Estimate the effect in each cell with a valid ATE estimator (e.g. AIPW per group).
Two rules for honest stratification
Coarse: few groups, chosen before seeing outcomes — not data-dredged. Pre-specified: subgroups picked after looking at \(\hat\tau\) are how false discoveries are born.
The interaction trap: a confounded coefficient
Tempting shortcut: one OLS with a treatment × modifier interaction — \[Y = \alpha + \tau\,D + \gamma\,H + \delta\,(D\times H) + \varepsilon\] and read \(\delta\) as “how the effect varies with \(H\)”.
Why this breaks
If \(H\) is also a confounder, the interaction \(\delta\) is biased by the same confounding that biases \(\tau\) — and the controls enter linearly, so any nonlinear confounding leaks straight into \(\hat\delta\).
On ShopSphere frequency confounds and modifies — exactly the case where the raw interaction misleads. We need a method that de-confounds first, then describes variation.
GATE = regress the score on the group
The spine, second appearance. We already have a de-confounded per-unit label \(\psi_i\) with \(\mathbb{E}[\psi\mid X]=\tau(x)\). So regress \(\psi\) on group dummies:
\[\widehat{\text{GATE}}(g) \;=\; \frac{1}{n_g}\sum_{i \,\in\, g} \psi_i \;=\; \bar\psi_{\,g}\]
That is just the group mean of the score — and an OLS of \(\psi\) on group indicators returns each GATE as a coefficient with a valid standard error.
The confounding was already removed when we built \(\psi\) (cross-fitted \(\hat\mu_1,\hat\mu_0,\hat e\)). No interaction trap: de-confound first (in \(\psi\)), then describe (by group).
Why the inference is valid
Two reasons the GATE standard errors are trustworthy:
- The score is orthogonal. Small errors in the nuisances \(\hat\mu_1,\hat\mu_0,\hat e\) do not contaminate \(\bar\psi_g\) to first order — the same Neyman orthogonality that made the S08 ATE valid.
- The groups are pre-specified and low-dimensional. A handful of fixed cells means standard OLS inference on \(\psi\) applies directly — no post-selection penalty. (Semenova and Chernozhukov 2021)
The free lunch
Group-level heterogeneity comes with honest confidence intervals — because it is just an average of an orthogonal score over fixed groups.
The coupon helps the lapsed — and hurts the loyal
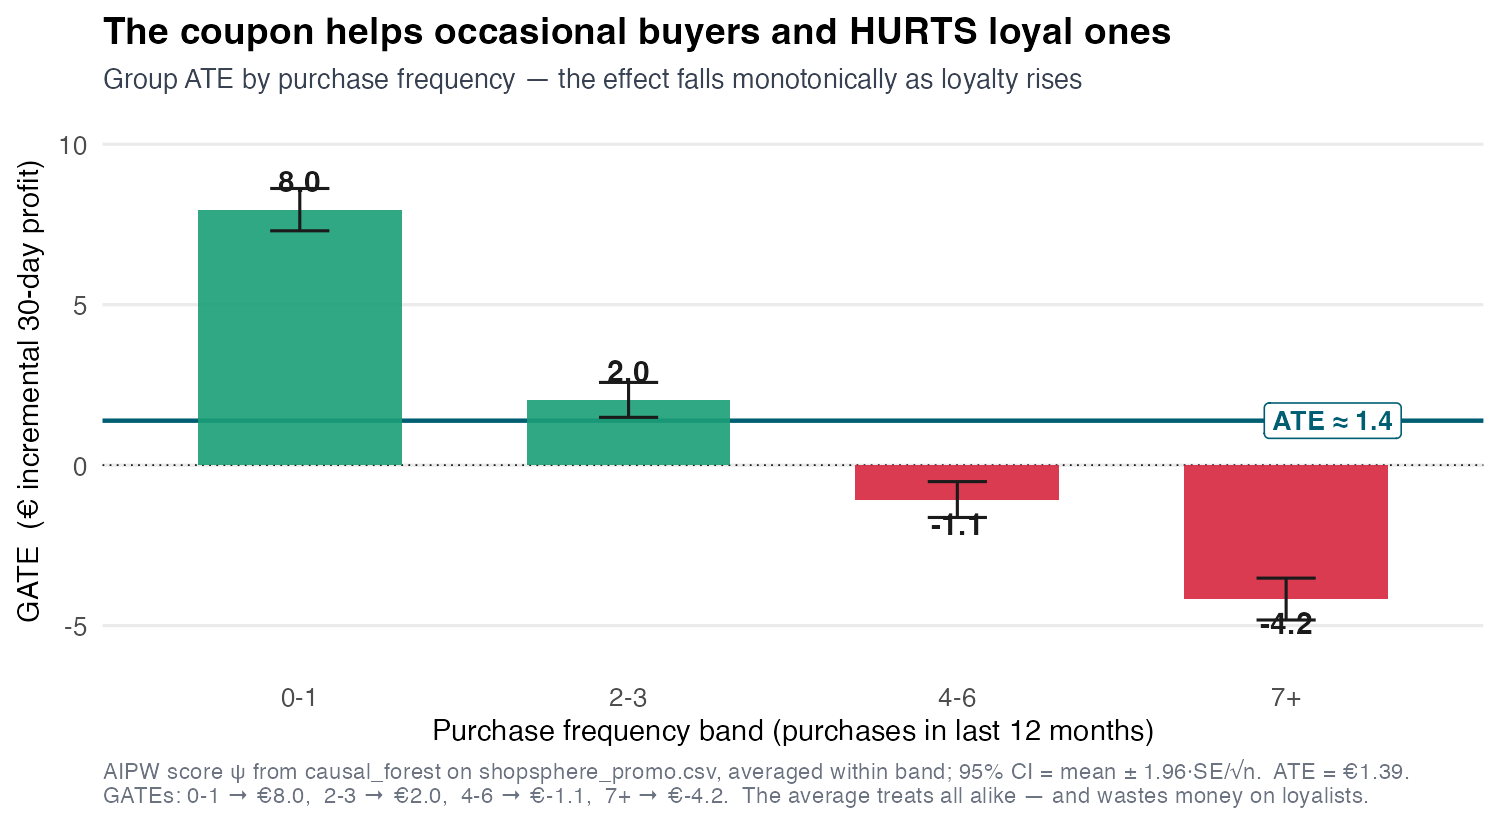
GATE by frequency band: 0–1 buys: +€8.0 · 2–3: +€2.0 · 4–6: −€1.1 · 7+ buys: −€4.2. The “meh” €1.4 average was masking a sign change.
From bands to a smooth curve
Bands are reportable but blunt. To resolve \(\tau\) along a continuous modifier, replace group dummies with a flexible basis:
\[\widehat{\tau}(h) \;=\; \text{smooth of } \psi_i \text{ on } h_i \qquad (\text{kernel or spline regression of the score})\]
Same spine — regress \(\psi\) on the modifier — but the “groups” become a continuum. This recovers a curve instead of bars.
But once the modifier is multivariate (frequency and recency and tenure …), hand-picked bases break down. We need a learner that finds the structure itself — Act 3.
GATE reports, \(\tau(x)\) targets
The division of labour, restated
GATE — coarse, honest CIs, board-ready. The number you put in a slide deck for stakeholders. \(\tau(x)\) — fine, individual-level, the engine that drives ranking and targeting.
You can report GATEs and still act on \(\tau(x)\) — the two are complementary, not competing.
Next: estimate the continuous \(\tau(x)\) — and confront the fact that flexible learners invent heterogeneity if you let them.
Estimating the Engine: Forests & Meta-Learners
The obvious idea: model each arm, subtract
The meta-learner recipe: build \(\tau(x)\) out of off-the-shelf regressions.
- S-learner (single): fit one model \(\hat\mu(D,X)\) with \(D\) as a feature; \(\hat\tau(x)=\hat\mu(1,x)-\hat\mu(0,x)\).
- T-learner (two): fit \(\hat\mu_1(x)\) on the treated and \(\hat\mu_0(x)\) on the controls separately; subtract.
Both are intuitive and use any regressor you like. But both optimize the wrong objective — next slide.
Predicting \(Y\) well ≠ estimating \(\tau\) well
The meta-learner critique
S- and T-learners minimize outcome prediction error (MSE on \(Y\)). But \(\tau(x)\) is a difference of two large surfaces — a learner tuned to predict \(Y\) can be badly tuned to estimate their difference. (Curth and Schaar 2023)
Two failure modes:
- S-learner: regularization can shrink the weak \(D\) signal toward zero — understating heterogeneity.
- T-learner: two independently-tuned models differ in smoothness; their difference inherits spurious structure.
The cure: target the causal quantity directly — split on effect heterogeneity (forests) or regress the score (DR-learner). (Lechner 2018)
Causal trees: split where the effect differs
A causal tree changes the splitting rule. A regression tree splits to make \(Y\) homogeneous; a causal tree splits to make the treatment effect differ across leaves.
- Each leaf is a subgroup; the leaf’s effect estimate is the within-leaf treated-minus-control gap.
- Splits are chosen to maximize the difference in \(\hat\tau\) between child leaves.
The danger: choosing and estimating on the same data
Pick the split and estimate the leaf effect from the same rows, and you bias the effect toward the split — the leaf looks more extreme than it is. (Overfitting the heterogeneity.)
Honesty: separate the splitting from the estimating
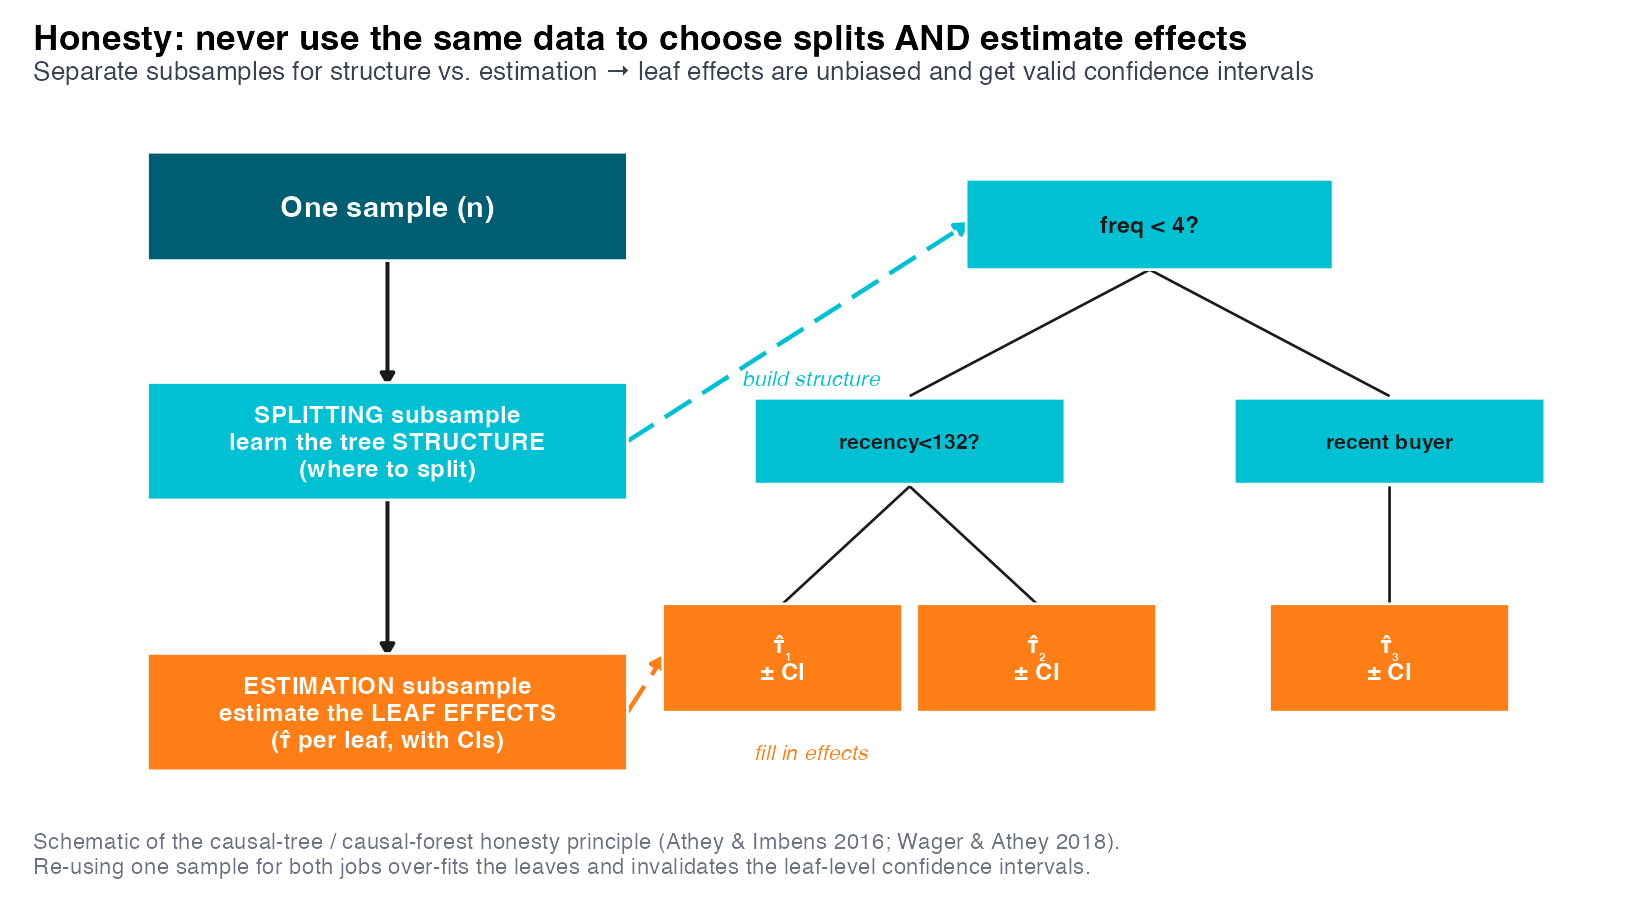
Honest estimation: use one subsample to choose the splits, a different subsample to estimate the leaf effects. The effect estimate never sees the data that chose its split → unbiased within-leaf. (Athey and Imbens 2016)
Causal forests: many honest trees, adaptively weighted
A causal forest averages many honest causal trees — but it is more than an average. (Wager and Athey 2018; Athey, Tibshirani, and Wager 2019)
- Each tree defines, for a target point \(x\), which training units fall in its leaf — i.e. which units are “like \(x\)”.
- Across trees, this yields adaptive weights \(\alpha_i(x)\): data-driven neighbours of \(x\), with the forest deciding which covariates matter for similarity.
- \(\hat\tau(x)\) solves a local estimating equation, weighting units by \(\alpha_i(x)\).
In effect: a forest is adaptive nearest-neighbour matching, where the metric is learned to track effect heterogeneity — not outcome level.
The forest solves a locally-weighted version of the same moment
At each target point \(x\), the forest estimates \(\hat\tau(x)\) by solving a locally-weighted version of the same moment we have used all along — units near \(x\) count more:
\[\sum_i \alpha_i(x)\,\psi\big(W_i;\,\tau(x)\big) \;=\; 0\]
- \(\alpha_i(x)\) — the forest’s learned similarity weights (how much unit \(i\) looks like \(x\)).
- \(\psi\) — the same orthogonal score from S08, on unit \(i\)’s data \(W_i=(Y_i, D_i, X_i)\).
So the forest is the local cousin of DML: globally average the score → ATE; locally weight it → \(\tau(x)\). (Splitting algebra lives in the notes.)
The forest recovers the true effect; the T-learner is noisier
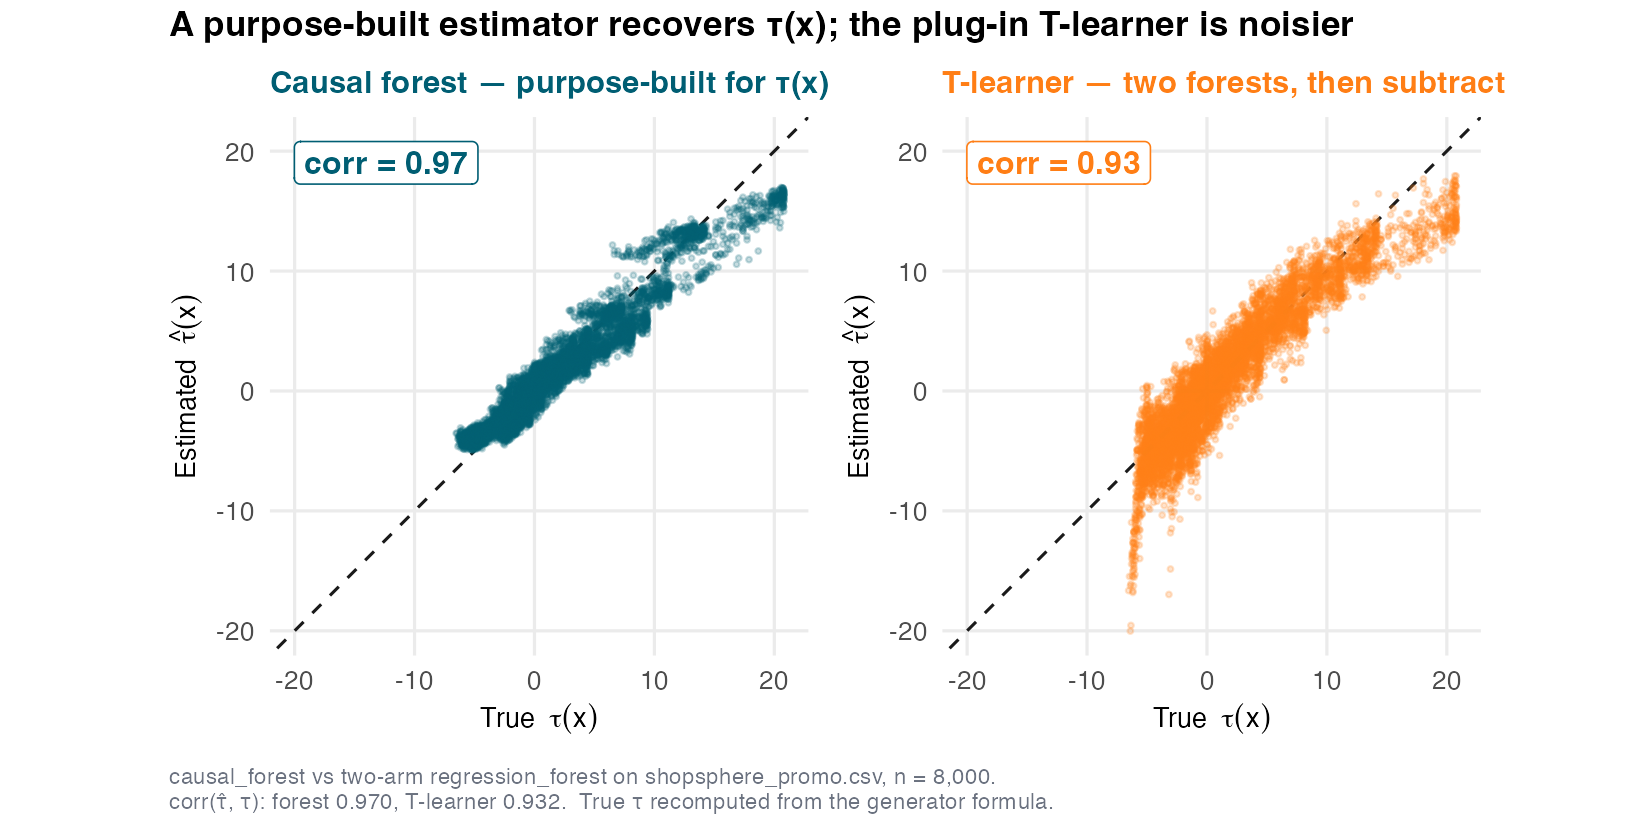
Estimated vs known true \(\tau(x)\): causal forest tracks truth at corr 0.97; the T-learner is visibly noisier at corr 0.93. Targeting the causal quantity pays off.
See the heterogeneity: a wide spread of effects
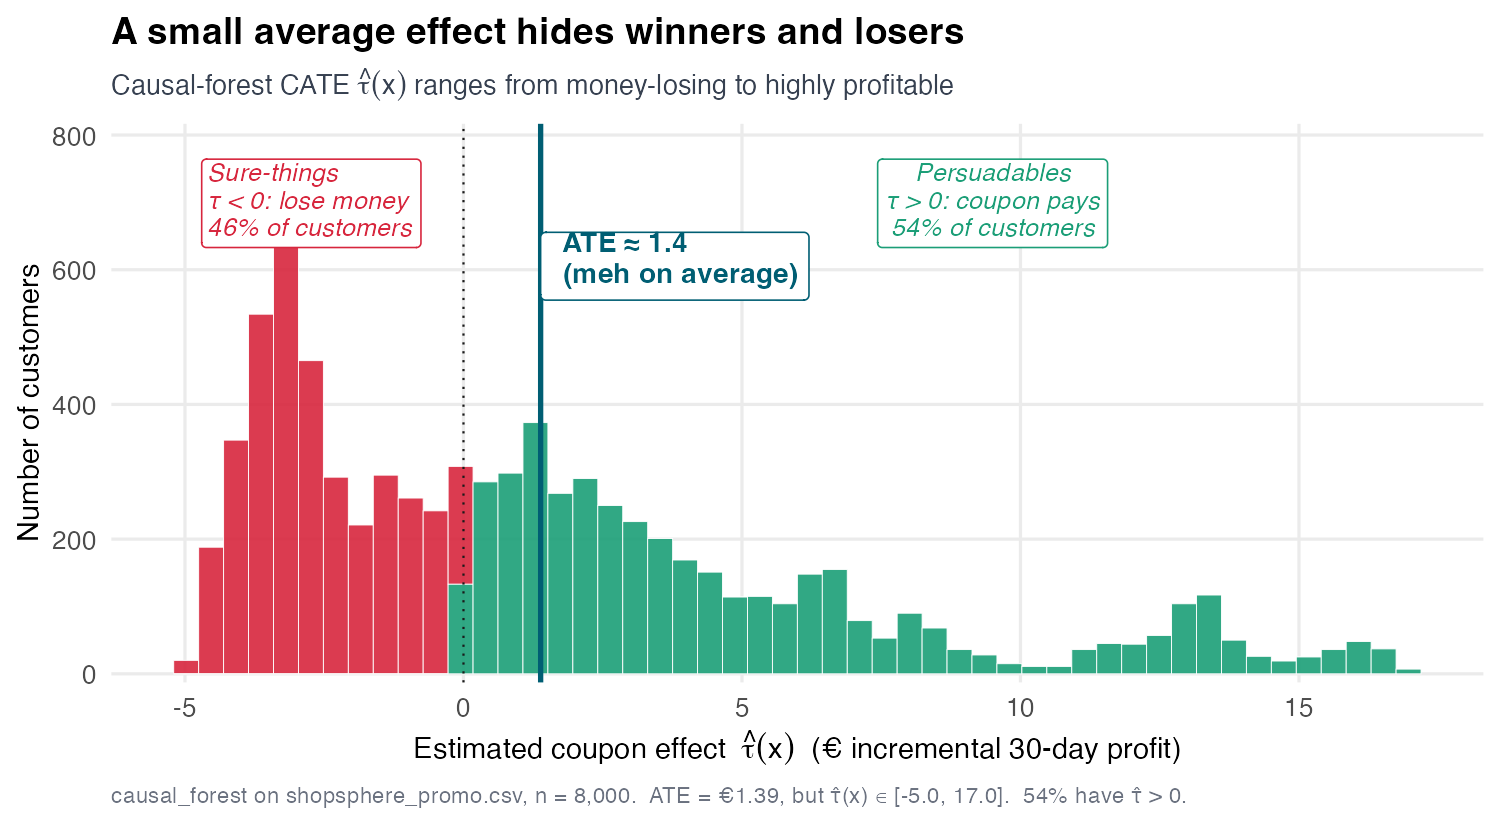
The estimated \(\hat\tau(x)\) ranges from −€5 to +€17 (SD ≈ 5.0), centred near the €1.4 ATE. About 54% of customers have a positive estimated effect. The average was the tip of an iceberg.
A field guide to meta-learners: what each regresses
| Learner | What it regresses | Targets \(\tau\) directly? | Watch out for |
| S | \(Y\) on \((D,X)\), one model | no (difference of preds) | shrinks \(D\) away |
| T | \(Y\) on \(X\) per arm, two models | no (difference of preds) | mismatched smoothness; halves data |
| X | imputed unit effects on \(X\), propensity-blended | closer | helps under treatment imbalance |
| R | \(\tilde Y\) on \(\tilde D\) (Robinson residuals), \(\tau(x)\)-weighted | yes | needs good nuisances |
| DR | the AIPW score \(\psi\) on \(X\) | yes (orthogonal) | the spine — our default |
The pattern: S/T predict \(Y\) and subtract; X/R/DR target \(\tau\) itself. Causal forests can fit the R- or DR-style objective internally. (Künzel et al. 2019; Nie and Wager 2021; Kennedy 2023)
X-learner: borrow strength under imbalance
When one arm is much larger (few treated, many controls — common in observational data), the X-learner uses both arms efficiently: (Künzel et al. 2019)
- Fit \(\hat\mu_1,\hat\mu_0\) (the T-learner step).
- Impute each unit’s effect using the other arm’s model: \(\hat\tau_i = Y_i - \hat\mu_0(X_i)\) for treated, \(\hat\mu_1(X_i) - Y_i\) for controls.
- Regress these on \(X\) within each arm → \(\hat\tau_1\) (treated), \(\hat\tau_0\) (control), then blend by the propensity:
\[\hat\tau(x)\;=\;\big(1-\hat e(x)\big)\,\hat\tau_1(x)\;+\;\hat e(x)\,\hat\tau_0(x)\]
The blend leans on the larger arm’s (better-estimated) model where data is thin — visibly better than the plain T-learner when treatment is rare.
R-learner: the Robinson residual, made local
The R-learner targets \(\tau(x)\) through the Robinson partialling-out you know from DML — now with a slope that varies in \(x\): (Nie and Wager 2021)
\[\hat\tau(\cdot) \;=\; \arg\min_{\tau}\ \sum_i \Big[\underbrace{(Y_i-\hat\ell(X_i))}_{\tilde Y_i} - \tau(X_i)\,\underbrace{(D_i-\hat e(X_i))}_{\tilde D_i}\Big]^2\]
\(\hat\ell(X)=\mathbb{E}[Y\mid X]\), \(\hat e(X)=\mathbb{E}[D\mid X]\) are the S08 cross-fitted nuisances; built on \(\tilde Y,\tilde D\) it inherits DML’s orthogonality.
Factor out \(\tilde D_i^2\) → an ordinary weighted regression:
\[\hat\tau(\cdot) \;=\; \arg\min_{\tau}\ \sum_i \underbrace{(D_i-\hat e(X_i))^2}_{\text{weight } w_i}\,\Big(\underbrace{\tfrac{Y_i-\hat\ell(X_i)}{D_i-\hat e(X_i)}}_{\text{pseudo-outcome } \tilde Z_i}\;-\;\tau(X_i)\Big)^2\]
Regress \(\tilde Z_i=\tilde Y_i/\tilde D_i\) on \(X\), weighted by \(w_i\) — any sample-weight learner (forest, boosting, NN) fits it; the weight vanishes where \(\tilde D_i\to0\), so \(\tilde Z_i\) can’t explode.
DR-learner: regress the score on \(X\) — the spine, again
The third appearance of the spine — and our default. Take the per-unit AIPW score and regress it on the covariates: (Kennedy 2023)
\[\hat\tau(x) \;=\; \widehat{\mathbb{E}}\big[\,\psi \,\big|\, X = x\,\big], \qquad \mathbb{E}[\psi\mid X=x]=\tau(x)\]
- Stage 1: cross-fit the nuisances \(\hat\mu_1,\hat\mu_0,\hat e\) → build \(\psi_i\) (S08).
- Stage 2: regress \(\psi_i\) on \(X\) with any flexible learner.
Doubly robust and orthogonal, so the second-stage learner can be a black box without contaminating \(\tau(x)\) to first order. This is why a causal forest fit on \(\psi\) recovers truth so well.
Which learner? None dominates — match the problem
Practical guidance
Default to DR-learner / causal forest (orthogonal, targets \(\tau\)). Reach for the X-learner under heavy treatment imbalance. Use S/T only as quick baselines. (Curth and Schaar 2023)
But there is no universally best learner — the winner depends on the true \(\tau(x)\) surface (smooth vs sparse vs sharp), the sample size, and overlap.
The unifying lesson
What makes all the good ones good is the same thing: an orthogonal score that targets \(\tau\) directly, not the outcome \(Y\).
The orthogonal score does the heavy lifting
Step back. Across forests, R-learner, and DR-learner, the engine is the same:
- Partial \(X\) out of \(Y\) and \(D\) (cross-fitted nuisances) — the S08 move.
- Target \(\tau\) directly via an orthogonal score, locally (forest weights) or by regression (DR-learner).
- Inherit robustness: small nuisance errors do not contaminate \(\hat\tau(x)\) to first order.
So heterogeneity estimation is not a new paradigm — it is DML, refusing to take the final average.
Is the Heterogeneity Real? Validation
A flexible learner always draws a wiggle
The uncomfortable truth
Fit a causal forest on data with zero true heterogeneity (\(\tau(x)\equiv\text{const}\)) and you still get a varying \(\hat\tau(x)\) — a wiggly histogram of pure noise.
The estimate looks the same whether heterogeneity is real or invented. So before acting, we must answer two questions with inference, not eyeballing:
- Is it real? Does \(\hat\tau(x)\) carry genuine signal about the true effect? → BLP / calibration test
- Is it worth it? Would targeting by \(\hat\tau(x)\) actually beat treating everyone? → RATE / TOC
The BLP test: does \(\hat\tau(x)\) predict the true effect?
Regress the orthogonal score \(\psi\) on the (out-of-fold) estimate \(\hat\tau(x)\) — the spine doing validation:
\[\psi_i \;=\; \beta_1 + \beta_2\,\big(\hat\tau(X_i) - \overline{\hat\tau}\big) + \varepsilon_i\]
- \(\beta_1\) — calibration of the level: is the average effect right? (≈ ATE.)
- \(\beta_2\) — calibration of the slope: when \(\hat\tau\) says “bigger”, is the effect actually bigger?
The decisive coefficient
\(\beta_2 = 1\): \(\hat\tau\) is perfectly calibrated. \(\beta_2 = 0\): \(\hat\tau\) is noise — it does not track the truth. Test \(H_0\!:\beta_2=0\). (Chernozhukov et al. 2018)
On ShopSphere, the heterogeneity is unmistakably real
| Quantity | Estimate | Reading |
Is the ranking real? test_calibration(cf) — project the score on the forest’s own \(\hat\tau\)
|
||
| Differential prediction (\(\beta_2\)) | 1.08 (\(t = 36.6\)) | \(\hat\tau\) tracks truth, slope ≈ 1 |
| Mean-forest calibration (\(\beta_1\)) | 0.955 | level ≈ correct (ATE) |
What drives it? best_linear_projection(cf, ·) — project on named covariates
|
||
Slope on frequency
|
−1.19 (\(p<2\!\times\!10^{-16}\)) | effect falls as frequency rises |
\(\beta_2 = 1.08\), \(p < 2\times10^{-16}\): we decisively reject \(H_0\!:\beta_2=0\) — the wide histogram was signal, not noise. A separate projection onto covariates then pins the gradient — the effect falls €1.19 per purchase — confirming the negative driver the GATE bars already ranked dominant.
Is it worth it? RATE ranks, then measures the gain
Real heterogeneity is necessary but not sufficient — we need to know targeting pays. The RATE (Rank-Weighted Average Treatment Effect) measures the gain from prioritizing by \(\hat\tau\): (Yadlowsky et al. 2025)
- Rank customers by \(\hat\tau(x)\), high to low (the spine: rank by the score).
- Treat the top \(q\) fraction; compute how much more effect they get than treating everyone — their average effect minus the overall ATE.
- Plot that benefit-over-treat-all against \(q\) → the TOC (Targeting Operator Characteristic) curve (it decays to 0 at \(q=1\)).
RATE = area under the TOC
If \(\hat\tau\) ranks well, the top customers gain much more than treating everyone — the TOC stays above the flat random-targeting line at 0. RATE > 0 (a QINI cousin) certifies the ranking has value.
The targeting curve: front-loaded gains
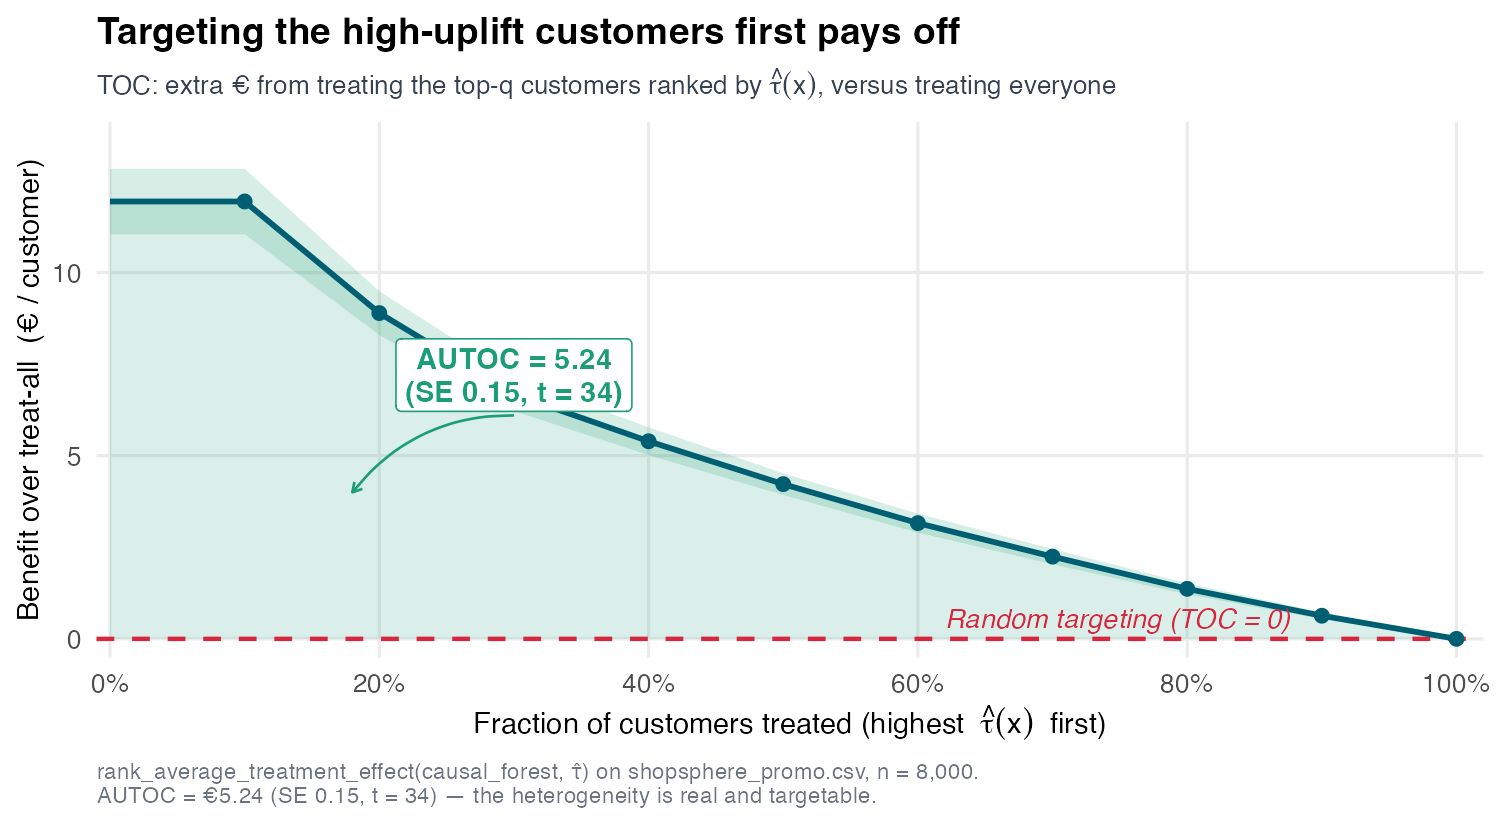
\(\widehat{\mathrm{TOC}}(q)=\overline{\psi}\,\big|_{\text{top-}q\text{ by }\hat\tau}-\overline{\psi}_{\text{all}}\) — the benefit over treat-all, scored by the doubly-robust \(\psi\) (rank by \(\hat\tau\), score by \(\psi\))
Treat the top-ranked customers and you gain far more than treating everyone — about €12/customer extra for the top decile, shrinking to €0 once you treat the whole base. RATE (AUTOC) = 5.24 (\(t = 34\)) — the ranking has real, sizeable value.
CLAN: who are the extremes?
Take the top- and bottom-\(\hat\tau\) groups and compare their covariate means — here, the profile across \(\hat\tau\) quintiles: (Chernozhukov et al. 2018)
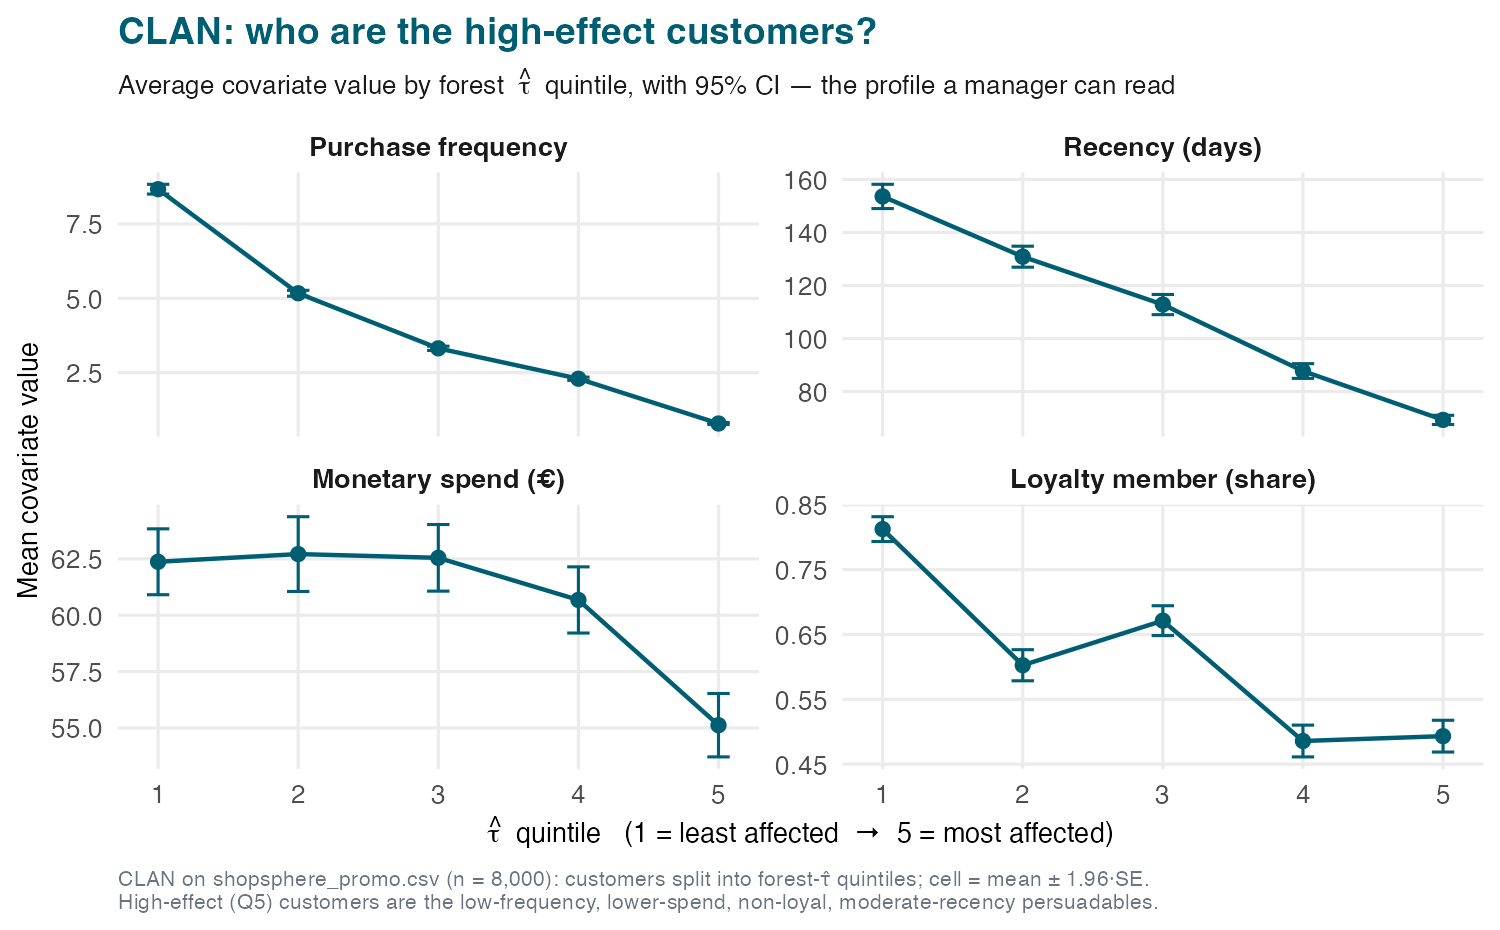
High-effect = low-frequency, recent, non-loyal persuadables; low-effect = loyal regulars. A describable persona — and a sanity check: if the extremes made no business sense, distrust the model.
The validation checklist
Before you act on \(\hat\tau(x)\), clear three gates
- Real? — BLP differential-prediction \(\beta_2\) significantly \(> 0\). (ShopSphere: 1.08, \(p<2e\text{-}16\) ✓)
- Worth it? — RATE / AUTOC significantly \(> 0\). (ShopSphere: 5.24, \(t=34\) ✓)
- Sensible? — CLAN extremes match domain intuition. (persuadables = lapsing customers ✓)
Only an estimate that clears all three earns a policy. A wiggly histogram alone earns nothing.
From Estimate to Decision: Policy Learning
The deliverable is a rule, not a curve
A manager cannot deploy a histogram. The deliverable is a policy — a function that says, for each customer, treat or not:
\[\pi : X \;\longrightarrow\; \{0, 1\}\]
We judge a policy by its value — the expected outcome if we deploy it:
\[V(\pi) \;=\; \mathbb{E}\big[\,Y(\pi(X))\,\big]\]
The goal of policy learning: find the \(\pi\) that maximizes value subject to constraints (budget, fairness, explainability) — not the \(\pi\) that best estimates \(\tau(x)\).
Why “treat everyone with \(\hat\tau>0\)” can fail
The naive policy: treat customer \(i\) iff \(\hat\tau(X_i) > 0\). Intuitive — but flawed.
CATE accuracy ≠ policy quality
A learner can have low CATE-MSE yet make bad decisions — what matters for a policy is getting the sign right near the threshold \(\tau(x)=0\), not the magnitude everywhere. (Qian and Murphy 2011)
- Errors far from zero are costly for MSE but irrelevant for the decision.
- Errors near zero are cheap for MSE but flip the decision — exactly where it hurts.
So we should optimize the decision boundary directly, not plug a noisy point estimate into a threshold.
Policy value: collect the effect on whom you treat
Since \(\pi\in\{0,1\}\), the deployed outcome is \(Y(\pi(X))=\pi(X)\,Y(1)+(1-\pi(X))\,Y(0)\). Take the expectation — the treat-none baseline drops:
\[V(\pi)=\mathbb E\big[Y(\pi(X))\big]=\underbrace{\mathbb E[Y(0)]}_{\text{treat-none baseline (constant)}}+\;\mathbb E\big[\pi(X)\,\tau(X)\big]\]
Only the second term depends on \(\pi\), so the value-maximizing rule collects the effect \(\tau\) where it treats:
\[\hat\pi=\arg\max_{\pi}\ \mathbb E\big[\pi(X)\,\tau(X)\big]\]
Treat where \(\tau>0\). Two refinements follow — both still in \(\tau\): recenter on a coin flip (the symmetric \(2\pi-1\) form), then — only once the formula is derived — replace the unseen \(\tau\) by the score \(\psi\).
…measured as your edge over a coin flip
Subtract the coin-flip value \(V(\tfrac12)=\tfrac12\mathbb E[Y(1)]+\tfrac12\mathbb E[Y(0)]\) (treating at random — the best rule ignoring \(X\)) — a constant in \(\pi\), so \(\arg\max\) is unchanged:
\[\begin{aligned} \hat\pi=\arg\max_\pi V(\pi) &=\arg\max_\pi\ \mathbb E[Y(\pi)] =\arg\max_\pi\ \mathbb E[Y(\pi)]-\tfrac12\mathbb E[Y(1)]-\tfrac12\mathbb E[Y(0)]\\[2pt] &=\arg\max_\pi\ \mathbb E\big[\pi Y(1)+(1-\pi)Y(0)\big]-\tfrac12\mathbb E[Y(1)]-\tfrac12\mathbb E[Y(0)]\\[2pt] &=\arg\max_\pi\ \mathbb E\big[(\pi-\tfrac12)Y(1)\big]+\mathbb E\big[(\tfrac12-\pi)Y(0)\big] =\arg\max_\pi\ \mathbb E\big[(\pi-\tfrac12)(Y(1)-Y(0))\big]\\[2pt] &=\arg\max_\pi\ 2\,\mathbb E\big[(\pi-\tfrac12)(Y(1)-Y(0))\big] =\arg\max_\pi\ \mathbb E\big[(2\pi-1)(Y(1)-Y(0))\big]\\[2pt] &\overset{\text{LIE}}{=}\ \arg\max_\pi\ \mathbb E\big[(2\pi-1)\,\tau(X)\big] \end{aligned}\]
Sample version, with the score (\(\mathbb E[\psi\mid X]=\tau\)):
\[\boxed{\,\hat\pi=\arg\max_{\pi}\ \tfrac1n\sum_i\big(2\pi(X_i)-1\big)\psi_i\,}\]
…which is weighted classification on the sign
Split each score into sign × size, \(\psi_i=\operatorname{sign}(\psi_i)\,|\psi_i|\), and three roles appear:
\[\tfrac1n\sum_i\big(2\pi(X_i)-1\big)\psi_i=\tfrac1n\sum_i\underbrace{|\psi_i|}_{\text{weight}}\;\underbrace{\operatorname{sign}(\psi_i)}_{\text{label }y_i}\;\underbrace{\big(2\pi(X_i)-1\big)}_{\text{prediction }\hat y_i}\]
Both \(y_i\) and \(\hat y_i\) live in \(\{-1,+1\}\), so their product is the classification margin: \(\,y_i\hat y_i=+1\) if the policy agrees with the sign (a right call), \(-1\) if it disagrees (a mistake). Maximizing weighted agreement is minimizing weighted misclassification:
\[\hat\pi=\arg\min_{\pi}\ \tfrac1n\sum_i|\psi_i|\,\cdot\,\mathbf 1\big\{\,2\pi(X_i)-1\neq\operatorname{sign}(\psi_i)\,\big\}\]
label \(=\operatorname{sign}(\psi_i)\) (treat the helped, withhold the hurt) · weight \(=|\psi_i|\) (the stakes) · classifier \(=\pi\). The sign/size split makes the weights \(\ge 0\), so any weighted classifier fits it — tree, logistic, SVM. (Athey and Wager 2021)
The policy tree: a rule you can defend
Restrict \(\pi\) to a shallow decision tree and the value-maximizing rule becomes human-readable: (Zhou, Athey, and Wager 2023)
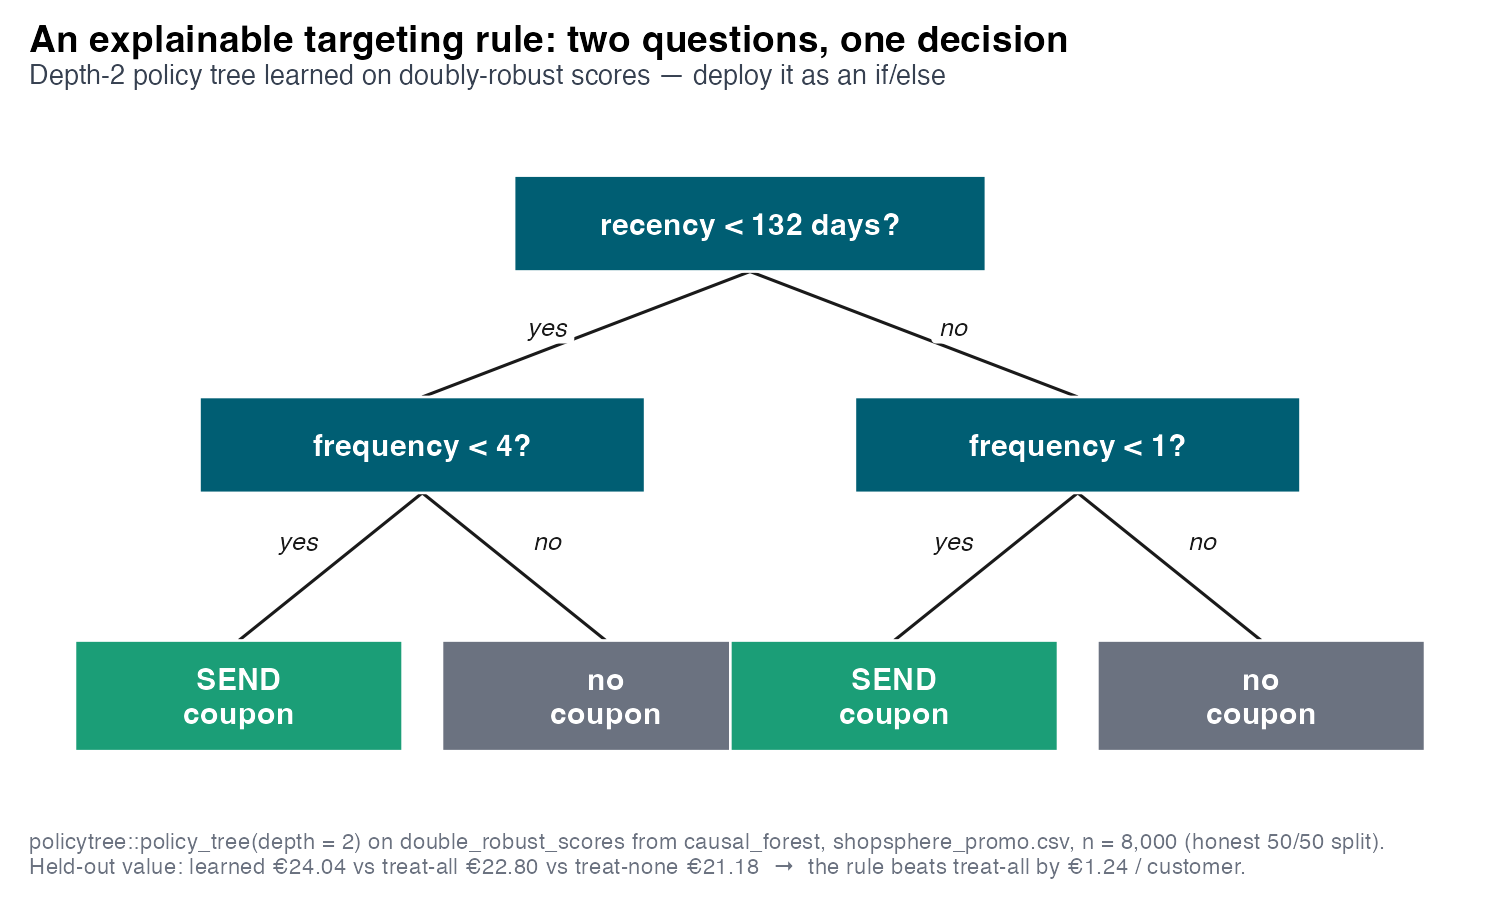
The rule sends the coupon to recent, infrequent buyers (recency < 132 and frequency < 4) and to the lapsed near-one-timer (recency ≥ 132 and frequency < 1) — net-positive since near-zero frequency leaves no margin to cannibalize. Everyone else: withhold — exactly the GATE story.
The learned policy beats treating everyone
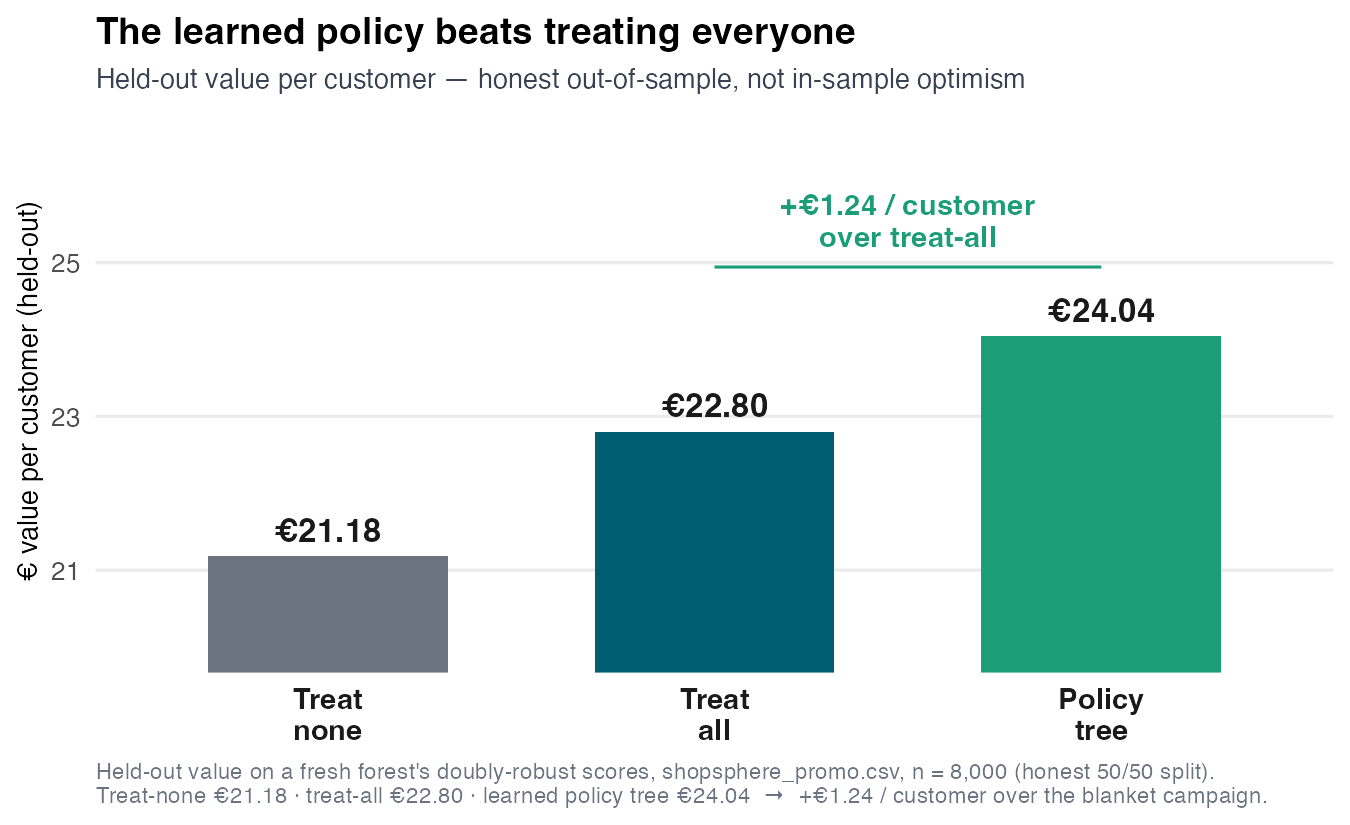
Held-out value per customer: treat-none €21.18 · treat-all €22.80 · policy tree €24.04. The two-question rule beats a blanket campaign by +€1.24 / customer — and beats treating no one by far more.
Don’t ship a policy you can’t audit
Before deployment
Report the policy’s value with a confidence interval (is +€1.24 distinguishable from treat-all?), and run CLAN on the policy — who does it treat, who does it withhold from? Audit for fairness and sensibility.
- A policy is a decision that affects people — explainability and a defensible value estimate are not optional.
- Prefer the policy tree (auditable) over a black-box threshold when stakes or scrutiny are high.
The deployment standard: a rule a stakeholder can read, a value they can trust, and a population you can characterize.
One Score, Four Jobs
Recap: stop averaging, start projecting
- The average lies. A “meh” €1.5 ATE hid effects from −€6.5 to +€20.8 — sign-flipping across customers.
- One score, four jobs. The S08 AIPW \(\psi_i\) (with \(\mathbb{E}[\psi\mid X]=\tau(x)\)): average → ATE (the S08 job); then four new jobs — group → GATE · regress on \(X\) → \(\tau(x)\) · rank → RATE · weight → policy.
- Estimate with orthogonality. Causal forests / DR-learner target \(\tau\) directly — predicting \(Y\) well is not estimating \(\tau\) well.
- Validate before believing. A flexible learner always draws a wiggle: clear BLP (real?), RATE (worth it?), CLAN (sensible?).
- Ship a rule, not a curve. Policy = weighted classification on \(\psi\); the policy tree beat treat-all by +€1.24 / customer.
Where this goes next
Closing Part IV — Causal Machine Learning
S08 + S09 are one method: orthogonalize and cross-fit the score, then either average it (ATE) or project it (heterogeneity, targeting, policy).
- Assignment IV (spans S08 + S09): de-confound an observational treatment, estimate and validate its heterogeneity, and recommend a targeting policy.
- Part V — Panel methods. The same orthogonal-score machinery powers Difference-in-Differences with flexible controls — Chang’s DML-DiD. (Chang 2020)
The through-line of the whole course: identify the effect, estimate it honestly, then act on it.
References
| Thank you for your attention! | |

 |
|
Causal Data Science for Business Analytics | 9. Treatment Effect Heterogeneity