7. Instrumental Variable Designs
Causal Data Science for Business Analytics
Hamburg University of Technology
Monday, 8. June 2026
From Confounding to Exogenous Variation
Last session, sensitivity analysis told us how strong a hidden confounder would have to be.
It never told us one wasn’t there.
When you can’t rule out U, stop arguing about its size — find a better source of variation.
S06 closed the backdoors we could SEE; S07 attacks the ones we cannot
| S06 — Observed Confounding | S07 — IV & RDD Designs | |
| Strategy | Adjust for measured X | Find exogenous variation in D |
| Tools | Matching, IPW, AIPW, sensitivity | Instrument Z, cutoff c (2SLS, fuzzy RDD) |
| Key assumption | No unobserved U given X | Z affects Y only through D |
| Fails when | A confounder is unmeasured | No credible nudge or cutoff exists |
The hinge is exactly the moment a sensitivity analysis admits a plausible U could overturn the result.
Unconfoundedness is untestable — sometimes you KNOW a U exists
The Law of Decreasing Credibility
“The credibility of inference decreases with the strength of the assumptions maintained.” — Manski (2003)
Every S06 method rested on one untestable assumption: \(D \perp\!\!\!\perp \{Y(0),Y(1)\} \mid X\).
Sensitivity analysis never tests it — it only bounds how big an unobserved U would have to be to break it.
In FitLife, user motivation U is unmeasured and plausibly drives BOTH opening the app and engaging with it. We don’t need to estimate U’s size to know it’s there.
FitLife: the algorithm we can adjust for, the user choice we cannot

Two treatments, two worlds: \(D_{\text{sent}}\) (the algorithm’s decision — confounded only by observed X, so S06 works) versus \(D_{\text{opened}}\) (the user’s choice — confounded by unobserved U, so S06 fails).
Stop adjusting — start hunting for as-good-as-random variation in D
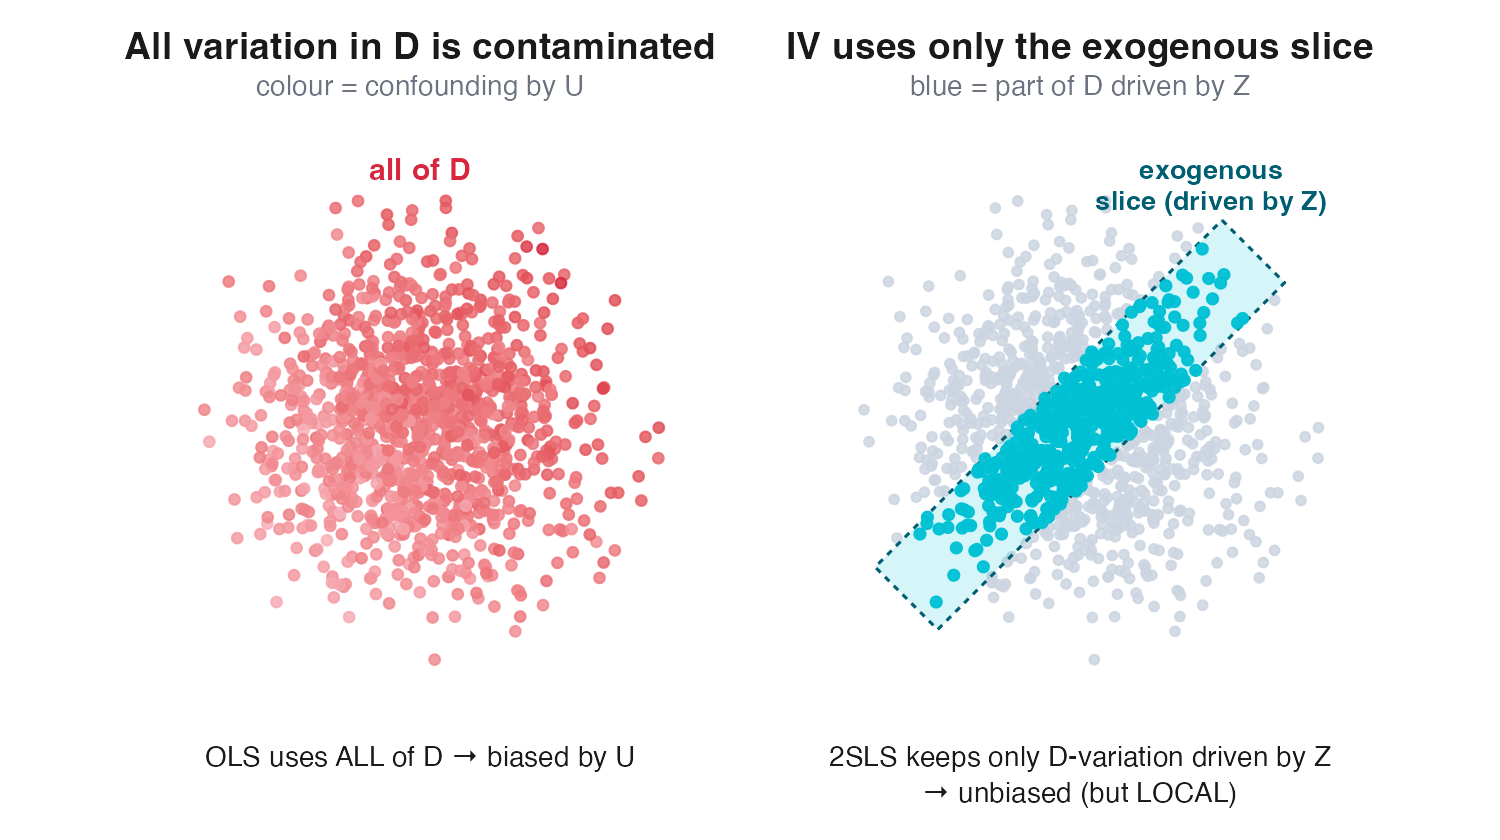
If you cannot block \(U \to D \to Y\), find a slice of variation in D unrelated to U — that exogenous slice identifies τ even when the rest of D is hopelessly confounded.
Two ways to harvest it: a nudge (IV) or a cutoff (RDD)

IV = a quasi-random nudge Z that shifts D. RDD = a quasi-random cutoff c that flips D. Same intuition, two devices — and both yield LOCAL effects.
What makes an instrument? The strangeness principle
A valid instrument’s link to the outcome should be puzzling to a smart layperson.
If the only way Z could possibly move Y is through D, then that strangeness is your evidence for the exclusion restriction.
Tech reskin: a randomly-timed reminder banner has no business changing engagement Y — except by getting the user to open the notification (D). Its irrelevance to everything else is the point.
The encouragement design IS an instrumental-variable design
You can’t withhold a shipped feature from users. But you can randomize a nudge to use it:
- banner / email / pop-up → Z (randomized)
- adoption / opening → D (the user’s choice)
- business metric → Y
This is exactly the FitLife pop-up: randomly shown, it nudges opening without forcing it.
Elbers (2023) document this as Spotify’s industry template for measuring feature effects.
A strong nudge produces a huge first-stage F — foreshadowing the weak-instrument problem.
What the Variation Buys You: Wald, 2SLS, and LATE
A four-step contract: intuition, then identification, then fragility, then field
We will work the same instrument through four questions — in order.
| Step | Question | Where |
| 1. Intuition | What is an instrument, and what variation does it buy? | this act |
| 2. What it identifies | Wald, 2SLS — and whose effect is it? | this act |
| 3. When it breaks | Weak instruments, invalid exclusion | Act 2 |
| 4. Where tech finds it | Lotteries, nudges, allocation rules, cutoffs | throughout |
The discipline: never skip step 2 — an IV that “works” still only answers a question about some people.
Three assumptions, all readable off a single DAG
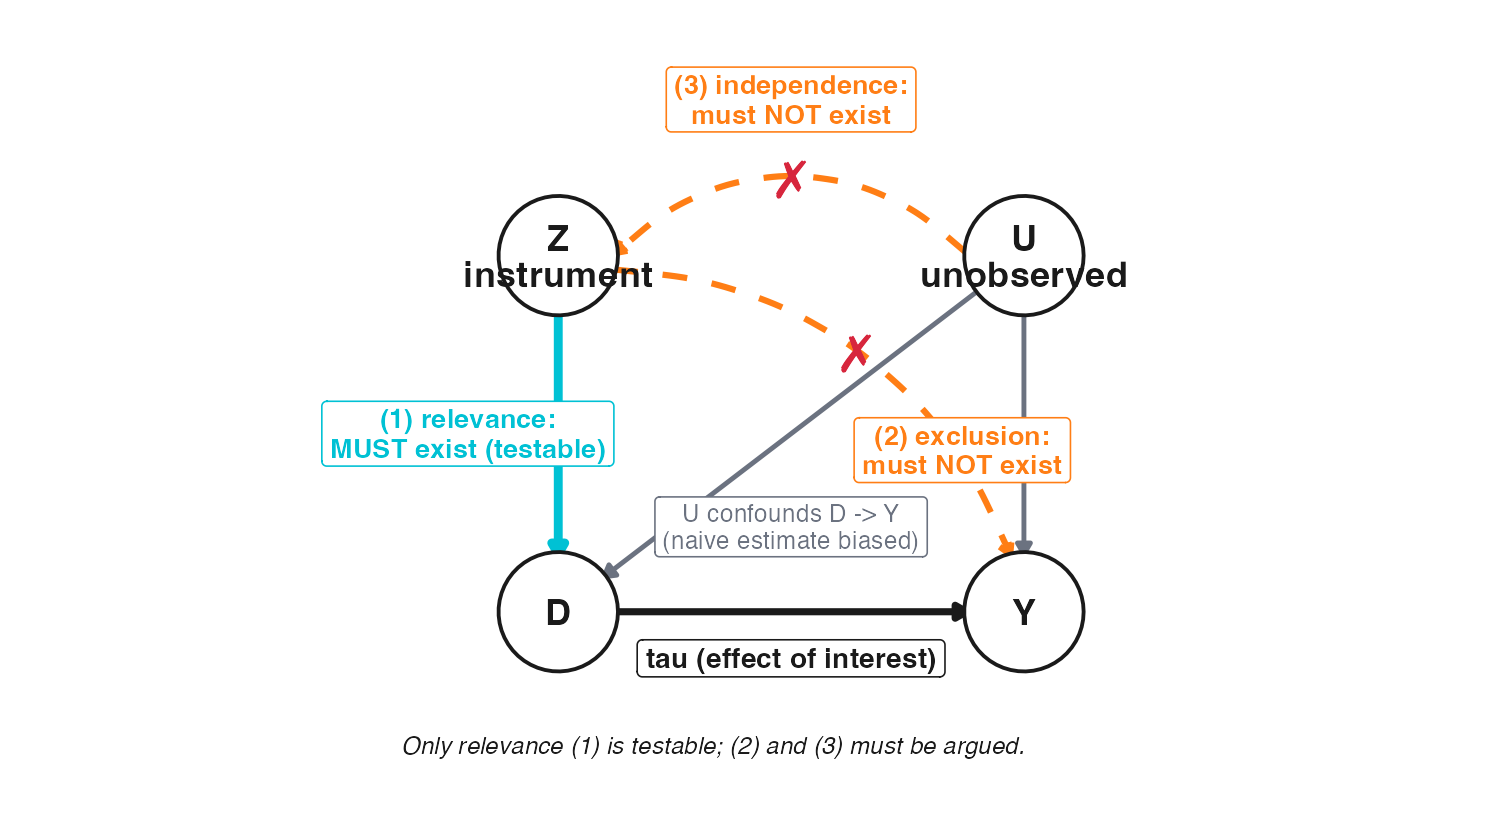
What each arrow must (not) be
(1) Relevance — Z → D MUST exist (and is testable). (2) Exclusion — a direct Z → Y must NOT exist. (3) Independence — U → Z must NOT exist. SUTVA underlies all three.
Finally — a testable assumption (and only one of three)
Relevance — checkable
The first stage Z → D shows up in the data. Run the regression, read the coefficient, read the F-statistic. If Z does not move D, you find out.
Exclusion + independence — argued
No regression certifies these. You defend them from institutional knowledge: how the instrument was assigned, and what else it could plausibly touch.
Most of the discipline lives in the argument, not the F-statistic. A strong first stage does not make an instrument valid.
Valid or invalid? Four instruments, four verdicts
| Proposed Z → D → Y | Verdict |
| (a) Firm size → R&D spend → patents | INVALID — size affects innovation directly (exclusion fails) |
| (b) Distance to training center → training → productivity | VALID — distance plausibly touches productivity only via training |
| (c) A new budget-allocation rule → ad spend → sales | VALID — rule-driven variation is as-good-as-random across units |
| (d) Firm profitability → benefits → satisfaction | INVALID — profitability drives satisfaction directly |
A live tech threat
The Spotify encouragement banner (Elbers 2023) might itself lift engagement — seeing the banner nudges you even if you never click. That is a direct Z → Y path: an exclusion violation. In FitLife the reminder’s wording is the design lever: a bare trigger (“1 new notification”) is far more excludable than a motivational banner (“Keep your streak alive!”) that can lift engagement with no open.
The Wald estimand: the nudge’s effect on Y, scaled by how much it moved D
With a binary instrument — and, for now, one effect \(\tau\) shared by everyone:
\[\tau \;=\; \frac{E[Y\mid Z=1]-E[Y\mid Z=0]}{E[D\mid Z=1]-E[D\mid Z=0]} \;=\; \frac{\text{reduced form}}{\text{first stage}}\]
Numerator — reduced form. How much the nudge moves the outcome: the effect of \(Z\) on \(Y\).
Denominator — first stage. How much the nudge moves take-up: the effect of \(Z\) on \(D\).
The nudge shifts \(D\) by the first stage; with a constant effect that shift carries through to \(Y\) at rate \(\tau\), so reduced form \(= \tau \times\) first stage — rise over run.
If a banner shifts opens by 16 points and lifts minutes by 1.3, the effect of opening is \(1.3 / 0.16 \approx 8\).
The same object, the covariance view: Cov(Y,Z) over Cov(D,Z)
For a general (not just binary) instrument, the identical estimand is:
\[\tau \;=\; \frac{\operatorname{Cov}(Y,Z)}{\operatorname{Cov}(D,Z)}\]
Difference-in-means view (binary Z): the Wald ratio of two contrasts.
Covariance / regression view (any Z): how Z co-moves with Y, scaled by how Z co-moves with D.
Two angles, one estimand. The covariance form is what generalizes to 2SLS with continuous instruments and controls.
2SLS is the Wald ratio with controls — and it is DAG surgery

Stage 1 project D on Z (and X) → predicted \(\hat{D}\). Stage 2 regress Y on \(\hat{D}\). Replacing D with \(\hat{D}\) severs U → D — U no longer touches the purged treatment.
Linear constant-effects model: \(Y = \tau D + X\beta + \varepsilon\), one constant slope \(\tau\). Linearity is a real assumption for continuous \(D\); for binary \(D\) (FitLife) it is automatic.
Never run 2SLS by hand — the second stage gets the standard errors wrong
By hand (two separate regressions): the point estimate is right, but the SEs are wrong — stage 2 treats \(\hat{D}\) as if it were observed data, ignoring that it was estimated.
Use a real IV routine: it propagates first-stage uncertainty correctly. Cluster SEs at the assignment level.
Drop homogeneity: IV identifies a local effect, not the global ATE
So far Wald / 2SLS read as the global ATE — which holds as long as either homogeneity does:
Same effect
One constant \(\tau\) — everyone responds to \(D\) alike.
Same compliance
Z moves every unit’s \(D\) — full compliance.
Reality breaks both: effects vary, and Z moves only some units’ \(D\) — not all.
The consequence
The instrument speaks only for the units it moves ⇒ IV gives a local ATE (the movers’ average), and only under monotonicity (no defiers). (Imbens and Angrist 1994)
→ which units move, which don’t? The four compliance types.
Four compliance types — only compliers are visible to the instrument
Defined by \((D(Z{=}1),\,D(Z{=}0))\): always-takers (1,1), never-takers (0,0), defiers (0,1), compliers (1,0). Always- and never-takers ignore Z entirely.
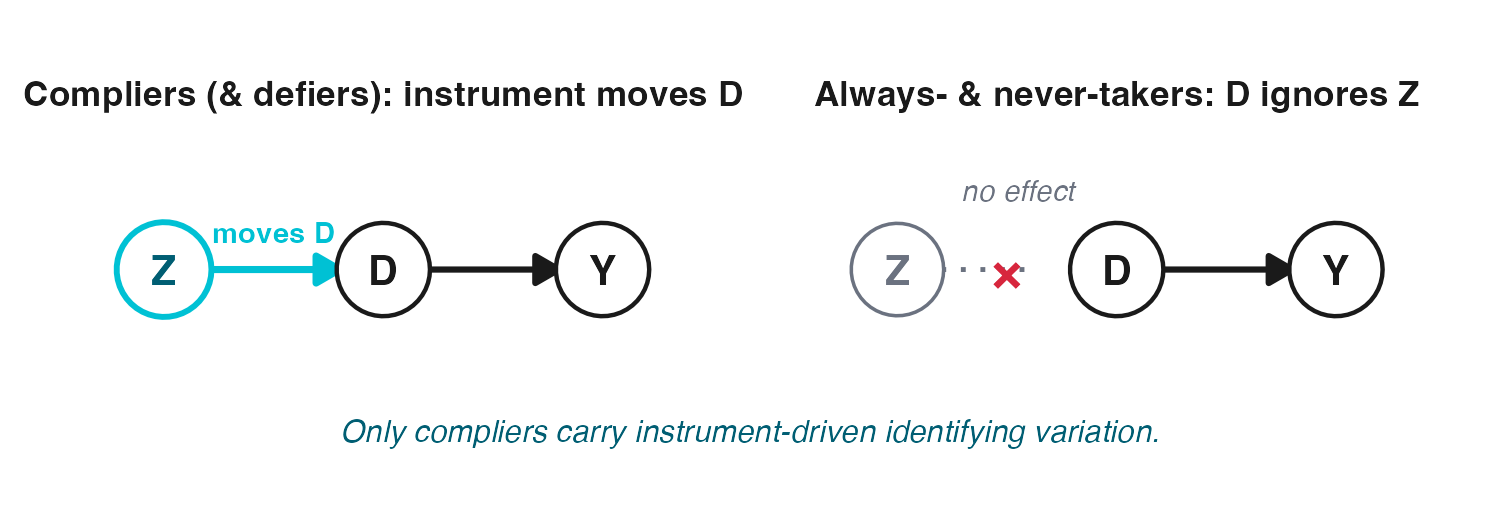
But the stratum is latent — each observed \((Z,D)\) cell fits two types:
| D = 0 (didn’t take) | D = 1 (took) | |
| Z = 0 | never-taker or complier | always-taker or defier |
| Z = 1 | never-taker or defier | always-taker or complier |
Monotonicity kills the defiers — and the math leaves only compliers
Assumption — Monotonicity (no defiers)
\(\forall i:\ \ D_i(Z{=}1) \ge D_i(Z{=}0)\) — the instrument moves everyone weakly the same direction.
Under exclusion, always- and never-takers contribute 0 to the reduced form — Z doesn’t change their D, so it can’t change their Y.
With defiers assumed away, only compliers move with Z — so the Wald ratio is exactly their average effect.
What survives in both numerator and denominator is compliers only — the local average treatment effect (LATE). The estimator is unchanged; only whose effect it is has been pinned down.
So the Wald ratio identifies a LATE — compliers, not everyone
Local Average Treatment Effect (LATE / CACE)
\(\text{LATE} \;=\; \mathbb{E}\big[\,Y_i(1) - Y_i(0) \,\mid\, \text{complier}\,\big]\) — the effect for the only stratum the instrument moves.
Identification (binary Z, D; independence, exclusion, monotonicity)
\(\dfrac{\mathbb{E}[Y\mid Z{=}1]-\mathbb{E}[Y\mid Z{=}0]}{\mathbb{E}[D\mid Z{=}1]-\mathbb{E}[D\mid Z{=}0]} \;=\; \dfrac{\text{ITT}}{\text{complier share}} \;=\; \text{LATE}\)
If compliers are ~16% of users, the LATE describes that 16% — not always-takers, not never-takers.
ITT and LATE answer different business questions
| Business question | What it tells you | |
| ITT | “Should we ship the nudge to everyone?” | the rollout number — effect of the policy as deployed |
| LATE | “What does adoption do for those it moves?” | the product-understanding number — effect of the behavior |
The tempting wrong answer
Computing the ATE with respect to \(D\) compares adopters to non-adopters directly. This comparison is biased by self-selection, as they differ in \(U\).
When the Variation Is Too Thin: Weak Instruments
A weak instrument is a nudge that barely moves D
If \(Z\) barely moves \(D\), almost no one is a complier and the LATE denominator collapses — so strength is the one IV property you measure, the first-stage F:
\[D = \pi_0 + \pi_1 Z + \mathbf{X}'\boldsymbol\gamma + v, \qquad H_0:\ \pi_1 = 0\]
\[F \;=\; \underbrace{\frac{\big(\mathrm{RSS}_{D\sim\mathbf{X}} - \mathrm{RSS}_{D\sim Z,\mathbf{X}}\big)/q}{\mathrm{RSS}_{D\sim Z,\mathbf{X}}/(n-k)}}_{\text{gain in fit}} \;=\; \underbrace{\frac{\hat\pi'(Z'Z)\,\hat\pi}{q\,\hat\sigma_v^2}}_{\text{signal / noise}} \qquad {\small q=\#\text{ excl. instruments}}\]
- Two readings, one number: the RSS drop from adding \(Z\) equals \(\hat\pi'(Z'Z)\hat\pi\), so “gain in fit” = “signal / noise” — and by FWL both partial out \(\mathbf{X}\).
- Covariates partialled out, not tested — only the excluded instrument(s) enter. Report this partial F (Cragg–Donald / Kleibergen–Paap), not the overall regression F.
- \(q=1\): \(F = t^2 = \big(\hat\pi_1/\mathrm{SE}(\hat\pi_1)\big)^2\), the squared t of the \(D\)-on-\(Z\) coefficient — weak = imprecise, not small.
Two dangers: the cure becomes the disease, and the precision is fake

Danger 1 — bias. As the first stage weakens, 2SLS is pulled toward the biased OLS plim; relative bias \(\approx \tfrac{1}{F+1}\), so at \(F\to 0\) the IV is no better than OLS (Bound, Jaeger, and Baker 1995).
Danger 2 — false precision. The reported CI looks tight, but it under-covers: the true coverage of a “95%” interval is far below 95%.
See it: the estimate degrades as the first stage weakens
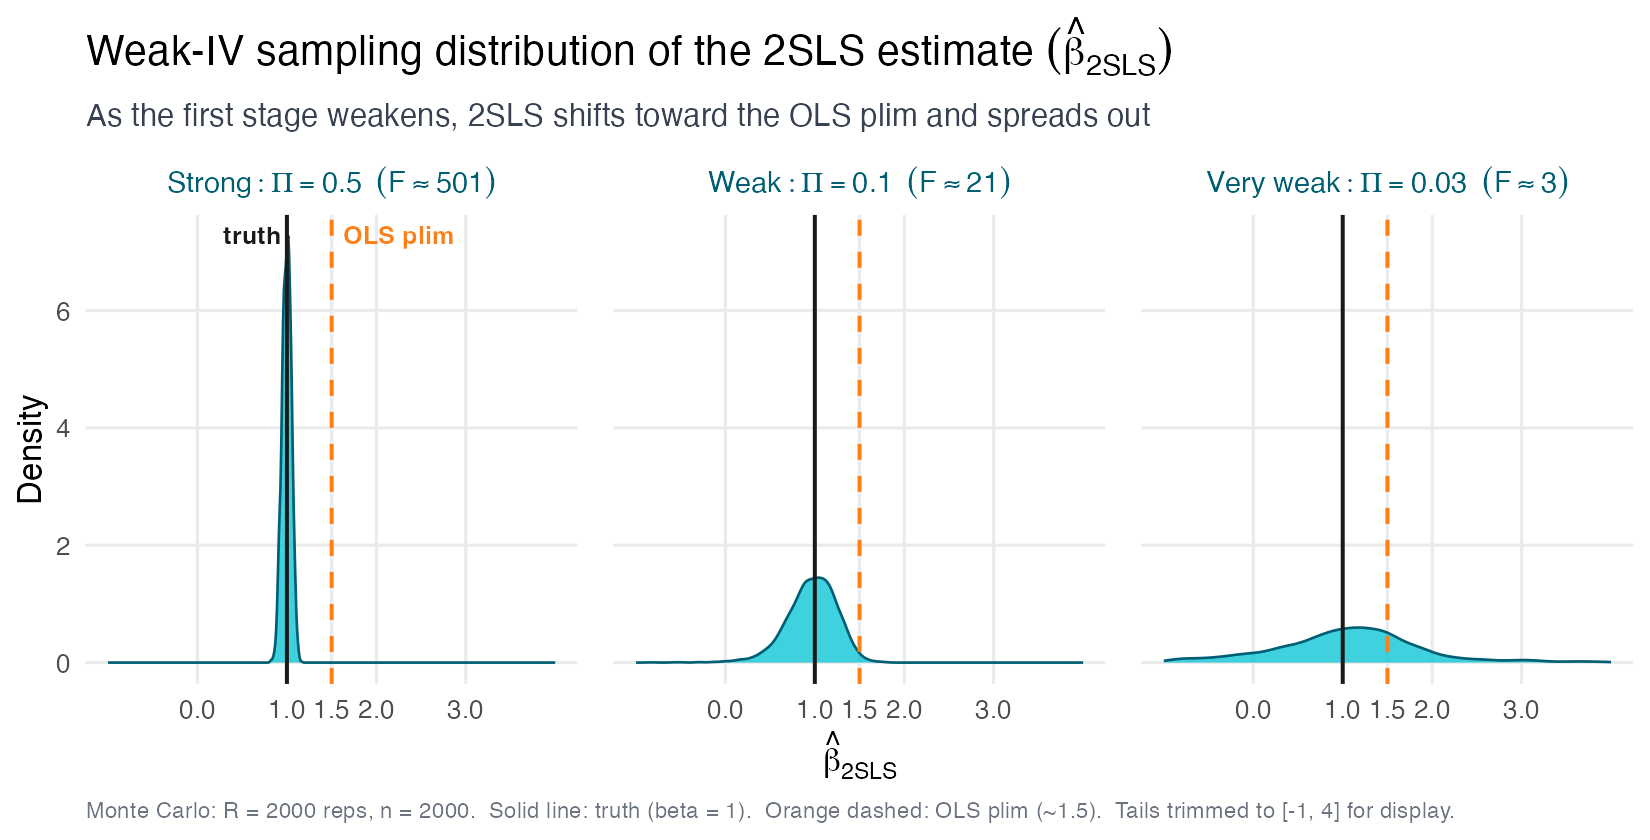
Simulated DGP: \(Y = \varepsilon,\ D = \Pi\, Z + \eta\) with \(\mathrm{corr}(\varepsilon,\eta)>0\). Step \(\Pi\) down and the 2SLS distribution drifts off the truth toward the OLS plim and fattens.
“F > 10” is a screen, not a certificate
The famous rule of thumb: a first-stage \(F > 10\) flags an instrument as “not catastrophically weak” (Staiger and Stock 1997). Stock and Yogo (2005) made it precise — tabulated critical values for a chosen bias or size tolerance.
What the threshold quietly assumes
- It bounds only the tolerance you picked (e.g. “2SLS bias under 10% of OLS bias”) — not a clean pass/fail for your estimate.
- It is derived under homoskedasticity and a single instrument.
- It is a floor, not a finish line: bigger is genuinely better — the bias curve keeps falling well past 10.
With real (heteroskedastic, clustered) data, report the EFFECTIVE F
The classical F (previous slide) needs i.i.d. errors; clustered data needs a robust version — three names, one job:
| First-stage statistic | What it is |
|---|---|
| Cragg–Donald F | the classical F (one treatment) — homoskedastic |
| Kleibergen–Paap rk Wald F (Kleibergen and Paap 2006) | its cluster-robust version (robust Cragg–Donald) — what ivreg2 / ivreghdfe print |
| Effective F (Montiel Olea and Pflueger 2013) | a different robust statistic with valid critical values — compare to its own (Montiel Olea–Pflueger) threshold, not 10 |
What to use: i.i.d. → classical F vs \(10\); clustered → the effective F vs its critical value. One instrument: all three are the same number — read the robust first-stage F (Python linearmodels, R fixest / ivreg). Several: the dedicated effective F via ivDiag (R).
F > 10 is too lenient for honest 5% inference
Lee et al. (2022) ask a sharper question: what first stage do you need so that a nominal 5% t-test on the 2SLS estimate truly rejects at 5%?
The honest threshold is much higher
A nominal 5% t-test has 5% size only if the first-stage F > 104.7 — not 10.
The tF procedure swaps the fixed \(1.96\) for a critical value \(\hat c(\hat F)\) indexed by the observed first stage, so the 95% CI becomes
\[\hat\beta \;\pm\; \hat c(\hat F)\cdot \widehat{\mathrm{SE}}(\hat\beta), \qquad \hat c(\hat F)\ge 1.96,\quad \hat c = 1.96 \iff \hat F \ge 104.7.\]
\(\hat c(\hat F)\) shrinks smoothly to \(1.96\) as \(\hat F\) grows — a weaker first stage automatically widens the interval, with no cliff-edge pass/fail.
The safety net: weak-IV-robust inference (Anderson–Rubin)
When you cannot trust the F, stop relying on the 2SLS standard error and switch to an interval that is valid regardless of instrument strength.
Anderson–Rubin confidence sets
Invert a test on the reduced form: for each candidate \(\beta_0\), regress \(Y-\beta_0 D\) on \(Z\) (and controls \(\mathbf{X}\)) and test \(H_0\): coefficient(s) on \(Z\) \(=0\). Keep every \(\beta_0\) the data do not reject — \[\text{AR set} = \big\{\beta_0 : \mathrm{AR}(\beta_0)\le F^{\alpha}_{k,\,n-k-p}\big\},\quad \mathrm{AR}(\beta_0)=\frac{(Y-\beta_0 D)'P_{\tilde Z}(Y-\beta_0 D)/k}{(Y-\beta_0 D)'M(Y-\beta_0 D)/(n-k-p)}.\] No first stage in the denominator → correct coverage at any strength; just-identified (\(k=1\)) it is the most powerful weak-robust test (Anderson and Rubin 1949).
When the instrument is weak the AR set comes out wider than the under-covering 2SLS t-interval — that width is the honest signal. Andrews, Stock, and Sun (2019): report the effective F; if it is borderline or just-identified, report AR sets.
Weak-IV checklist to take to the lab
Five rules for any IV estimate you report
- Always report the first-stage F — the effective / Kleibergen–Paap version under heteroskedasticity or clustering, never the naive homoskedastic one.
- Bigger than 10 is genuinely better. Treat 10 as a floor, not a finish line; honest 5% inference wants far more.
- When in doubt or just-identified, use Anderson–Rubin CIs — correct coverage at any strength.
- Report the ITT alongside the IV estimate. The reduced-form effect needs no first stage and anchors what the data actually show.
- A noisy weak-IV estimate can be worse than careful OLS — IV is not automatically the safer choice.
Where Tech Harvests Variation: the IV Design Family
Where do good instruments come from? Two sources
A valid Z must be as-good-as-randomly assigned and affect Y only through D. Two families deliver this:
1. Lotteries — purely random
- Encouragement / nudge experiments
- Draft, admission, prize lotteries
- Oversubscribed-program lotteries
Randomness you run.
2. Natural experiments — as-good-as-random
- Policy & regulation shocks
- Decision-maker variation
- Economic shocks, geography, weather
Randomness you find.
The art of applied IV is recognizing where the world has already done the randomizing for you (Angrist and Krueger 2001).
Lotteries: the gold-standard instrument by construction
A lottery randomizes eligibility, not treatment — which makes the assumptions credible by design.
Why the assumptions hold
- Independence: the draw is random, so \(Z \perp U\) — guaranteed, not assumed.
- Exclusion: winning a lottery has no path to Y except through the program.
The catch: imperfect take-up
Winners don’t all comply; losers sometimes get in anyway. Z shifts the probability of D, not D itself.
\[\tau_{LATE} = \frac{\text{ITT}}{\text{take-up}}\]
Scaling ITT by the take-up rate converts a “lottery-win” effect into the effect of actually receiving treatment, for compliers.
Tech lotteries: oversubscribed betas, waitlists, and the patent “lottery”
Capacity constraints — and the A/B tests you already run — turn ordinary product decisions into clean lotteries.
| Setting | Instrument Z | Treatment D | Outcome Y |
| Oversubscribed beta / waitlist | Random invite | Uses feature | Retention, revenue |
| Public-health program | Lottery win (Finkelstein et al. 2012) | Enrolls in coverage | Utilization, health |
| School admission | Seat lottery (Abdulkadiroğlu et al. 2011) | Attends school | Test scores |
| Patent grant | Examiner assignment (Farre-Mensa, Hegde, and Ljungqvist 2020) | Patent granted | Firm growth |
| Online ad A/B test | Random ad assignment (Gordon et al. 2019) | Actually sees the ad | Conversion, sales |
Winning raises P(use D) but not to 100% — the Oregon / charter-lottery structure.
Natural experiments: randomness you find
When you cannot run an experiment, find an event that is as-good-as-random — then pin down what it instruments.
| Randomness you find — Z → D → Y | ↳ But what else moved with Z? |
| Privacy rollout. iOS-14.5 timing (Z) → cross-app tracking on/off (D) → ad revenue/user (Y) | it also changed attribution & performance |
| Surge pricing. A hyper-local rain shock (Z) → surge multiplier shown (D) → booking conversion (Y) | rain also lifts ride demand directly |
| Latency. A CDN-edge incident (Z) → page-load delay felt (D) → checkout conversion (Y) | a wider outage also hits payment gateways & rivals |
| Recommender noise. Ranker perturbs what’s surfaced (Z) → item exposure (D) → click-through (Y) (Sharma, Hofman, and Watts 2015) | a new slot shifts attention, not just exposure |
The honest caveat
Each arrow is a claim, not a fact — and usually only conditional on X.
So ask what else moved with Z? You must argue and balance-test the randomness — never just assert it, or exclusion fails.
Judge/examiner leniency: a reusable recipe
A surprisingly general template appears wherever cases are routed to decision-makers.
The three-ingredient recipe
- A pipeline. Units flow through a process to a single decision point (grant / deny, approve / reject, flag / clear).
- Random routing. Decision-makers are (as-good-as) randomly assigned to cases — conditional on the office × time cell.
- Differing leniency. Decision-makers differ in how often they treat.
Then the assigned decision-maker’s leniency instruments the treatment: lenient-judge cases are more likely to be treated, but the judge touches Y only through that one decision.
Construct leniency the right way: leave-one-out, demeaned within the cell
The instrument is the decision-maker’s treatment rate — but built carefully to avoid mechanical bias.
Two fixes, both essential
- Leave-one-out (jackknife): compute the judge’s treatment rate on all their other cases, excluding case \(i\).
- Demean within the cell: subtract the office × time-period mean.
\[Z_i = \bar{D}_{-i,\,j(i)} - \bar{D}_{\text{cell}(i)}\]
Leave-one-out breaks the mechanical link to \(i\)’s own outcome.
Demeaning ensures Z varies only within the cell where assignment is random.
Without leave-one-out, case \(i\)’s own decision sits inside its own instrument — a built-in correlation that fakes a first stage.
Leniency’s fine print: exclusion, monotonicity, and many weak instruments
Three assumptions deserve scrutiny before you trust a leniency estimate.
| Assumption | What it means | Check |
|---|---|---|
| Exclusion | The decision-maker affects Y only through the focal decision | Argue: no side-channels (sentencing → rehab programs?) |
| Monotonicity | A more lenient decision-maker (weakly) treats everyone the stricter one would | Formal test: Frandsen, Lefgren, and Leslie (2023) |
| Many weak IVs | Each judge dummy is a weak instrument; there are many | UJIVE; cluster at the assignment level |
Leniency designs are a leading many-weak-instrument case — 2SLS is biased toward OLS here, so practitioners use a jackknife IV estimator — UJIVE. Full guide: Chyn, Frandsen, and Leslie (2025).
Tech leniency: patent examiners, loan officers, content moderators
The same machinery answers two distinct managerial questions.
Q1 — Effect of the decision
What does the decision do?
Lenient patent examiner ⇒ patent granted ⇒ more firm growth and employment (Farre-Mensa, Hegde, and Ljungqvist 2020).
Q2 — Audit for bias
Are decision-makers fair at the margin?
Compare marginal outcomes across loan officers to detect lending bias (Dobbie et al. 2021) (Arnold, Dobbie, and Yang 2018).
Content moderators, fraud reviewers, ad-policy reviewers = the template re-skinned. Randomly routed cases + reviewer leniency = a ready-made instrument inside your ops pipeline.
Shift-share: a predicted-exposure instrument
When a treatment is endogenous, build a predicted exposure from two pieces a unit can’t manipulate: its fixed exposure shares \(s_{ik}\) and a set of common shifts \(g_k\).
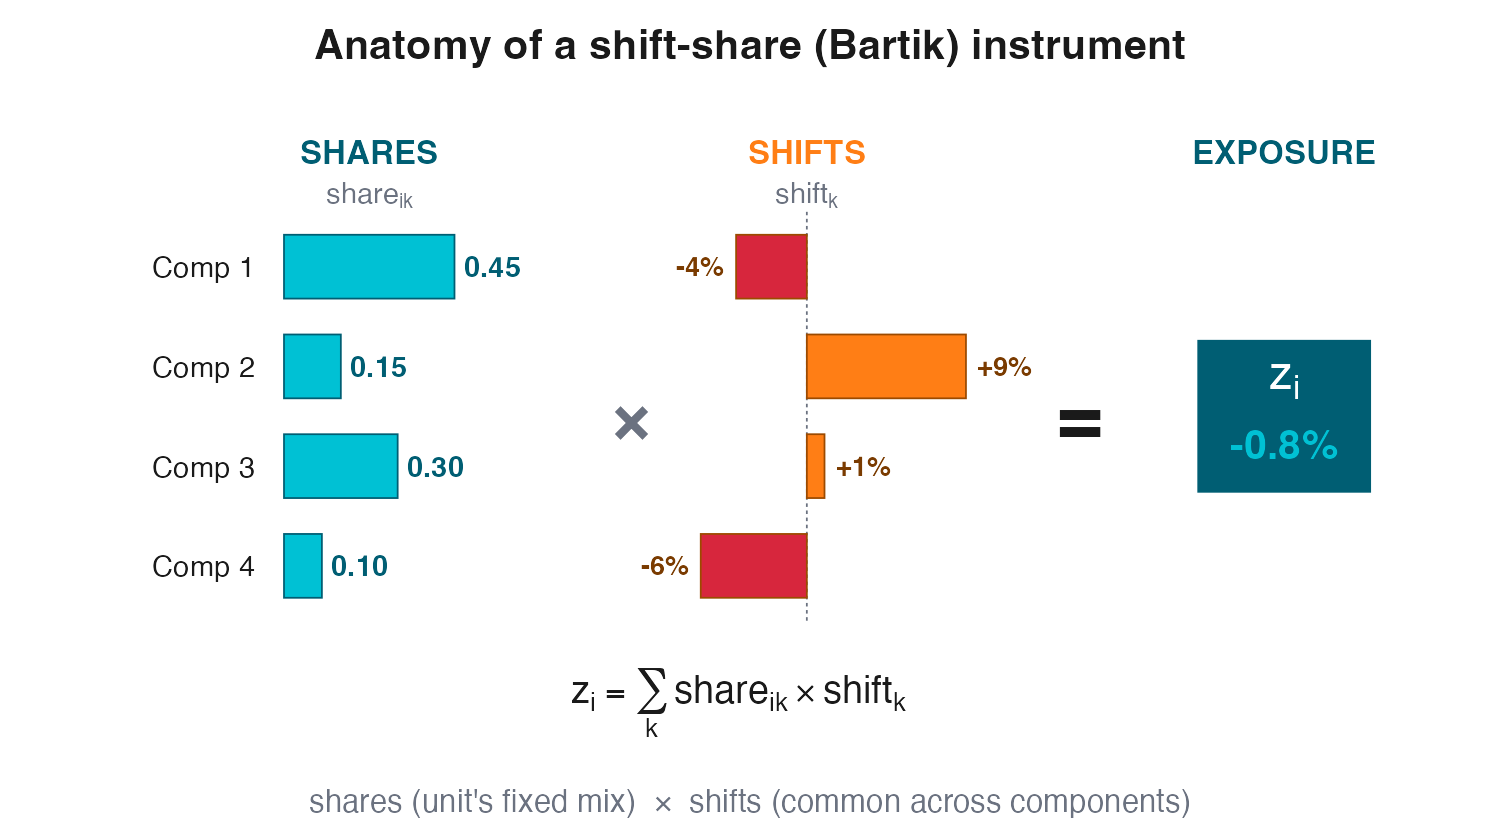
The product \(Z_i = \sum_k s_{ik}\,g_k\) predicts how hard unit \(i\) is hit — without using its own outcome. Exogeneity can live in either piece — shares or shifts. (Bartik 1991)
Where is the exogeneity — in the shares or the shifts?
Validity rests on one of two stories — and you must declare which.
Shares route (Goldsmith-Pinkham, Sorkin, and Swift 2020)
The shares are the instruments (Bartik 2SLS ≡ GMM on the initial shares) — really K stacked difference-in-differences.
Classic: immigrant enclave — an inflow lands in a city through its pre-existing migrant share (Card 2001).
Exogenous if the initial mix doesn’t predict later changes in Y. Rotemberg weights flag the few shares that carry the estimate.
Shifts route (Borusyak, Hull, and Jaravel 2022)
The shifts are as-good-as-random — and many — so the design holds even if the shares are endogenous. SSIV ≡ IV at the shift level.
Classic: the China shock — import growth measured in eight other rich countries purges US-specific demand (Autor, Dorn, and Hanson 2013).
Exogenous if enough independent shifts. Effective sample = # of shifts, not units.
Neither route is free — declare and defend one: a few high-weight shares (Rotemberg), or many, as-good-as-random shifts. Guide: Borusyak, Hull, and Jaravel (2025).
Tech shift-share: automation and AI exposure
Same skeleton — a predicted exposure (\(Z\)) instruments the actual, chosen exposure (\(D\)); the shares run over whatever the shift hits — industries (robots) or occupations (AI).
Robots (Acemoglu and Restrepo 2020)
\(D\) (treatment): local robot exposure \(=\sum_k s^{1990}_{\ell k}\,\Delta\text{robots}^{\text{US}}_k\) (\(s\) = a zone’s 1990 industry shares) — endogenous (US adoption tracks industry shocks).
\(Z\) (instrument): the same 1990 industry shares × European adoption \(\Delta\text{robots}^{\text{EU}}_k\) — exogenous (fixed mix, external frontier).
AI (being built now)
\(D\) (treatment): the firm’s actual AI adoption — endogenous (firms adopt on their own prospects).
\(Z\) (instrument): pre-period occupation shares × national AI shock per occupation, \(\sum_o s^{\text{pre}}_{\text{firm},o}\,\text{AI}_o\) — exogenous (fixed mix, external AI wave).
Still IV → still a LATE: a complier-weighted effect, not the effect on every zone or firm.
Shift-share in the wild: fansubbing as copyright infringement
Fansubbing a given anime is endogenous — hits attract subbers. So instrument the supply with a shift-share whose shift is exogenous.
The instrument
\[Z_{a} = \sum_{g} s_{g,a}\,\cdot\,\text{quit}_g\]
\(s_{g,a}\) = group \(g\)’s predicted (pre-period) propensity to sub anime \(a\); \(\text{quit}_g\) = group \(g\) disbands (the shift).
Likely subbers quit → less fansubbing \(D_a\) → effect on legal sales \(Y_a\) (substitution vs. sampling). A shifts-route bet: claim the quits are random, not the shares.
Why a quit can be ~random
Idiosyncratic group deaths: burnout, members graduate, internal drama, a lost translator.
⚠ Killer threat: groups quit because a show got licensed — which moves \(Y\) too. Reverse causation into the shift.
Fixes: predicted (not realized) shares; drop licensing-driven quits; many independent quits.
Standard errors are the headline pitfall (AKM)
Shift-share’s most dangerous failure is silent: confident intervals that should not be.
Why naive SEs lie
Regions with similar shares are exposed to the same shocks.
So residuals correlate across regions that may be geographically far apart — geo-clustering misses it entirely.
The fix
Use AKM / AKM0 standard errors (Adão, Kolesár, and Morales 2019).
R package: ShiftShareSE.
Exercise 8 shows it: naive 95% CIs cover only ~60% — AKM/exposure-robust SEs restore them.
The correlation is in exposure space, not geographic space — which is exactly why clustering by state does not save you.
All five so far share one move; the sixth uses a cutoff
Step back: every design in this act borrowed randomness the same way.
Encouragement, lottery, natural experiment, judge-leniency, shift-share — all borrow randomness through a NUDGE Z. The sixth design borrows it at a CUTOFF.
RDD: Variation at a Cutoff
Where is the treatment effect on this graph?
Yelp rounds review averages to half-stars — 3.74 → 3.5, 3.76 → 4.0.

Socratic prompt
Two businesses scored 3.74 and 3.76 are essentially identical — yet one rounds up to 4 stars. If the outcome jumps right at the line, what could explain it other than the badge? Hold that thought before we name anything.
The vocabulary, on one running example
Keep the Yelp rating example. One spine, five terms:
| Term | In the Yelp example |
| Running variable \(x\) | underlying review average (continuous) |
| Cutoff \(c\) | the rounding threshold, e.g. 3.75 |
| Trend \(E[Y\mid x]\) | revenue rises smoothly with reputation |
| Discontinuity / jump | the step in revenue right at \(c\) |
| Local regression | a line fit on each side, near \(c\) only |
The design’s whole claim: units just below and just above \(c\) are as-good-as-randomly assigned to treatment.
Smoothness vs discontinuity — identification is NOT estimation
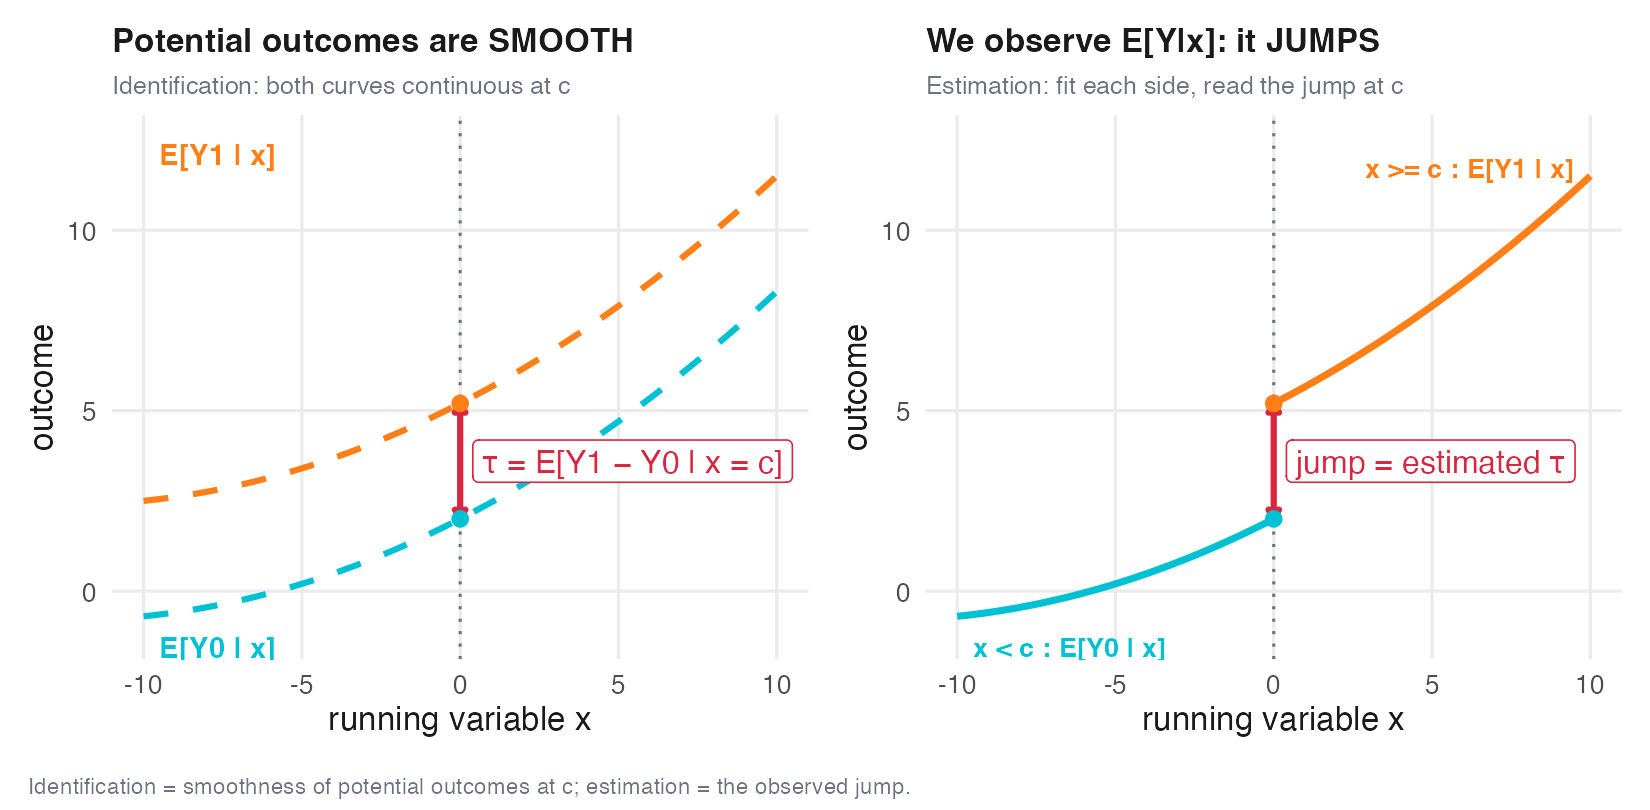
The core distinction
Assumed (unobservable): the potential-outcome curves \(E[Y_0\mid x]\) and \(E[Y_1\mid x]\) are smooth through \(c\) — so that the only thing changing discontinuously at the cutoff is the treatment.
Estimated (observable): the jump in \(E[Y\mid x]\) at \(c\) — what we actually see in the data.
Sharp RDD: the jump in E[Y] at c IS the effect
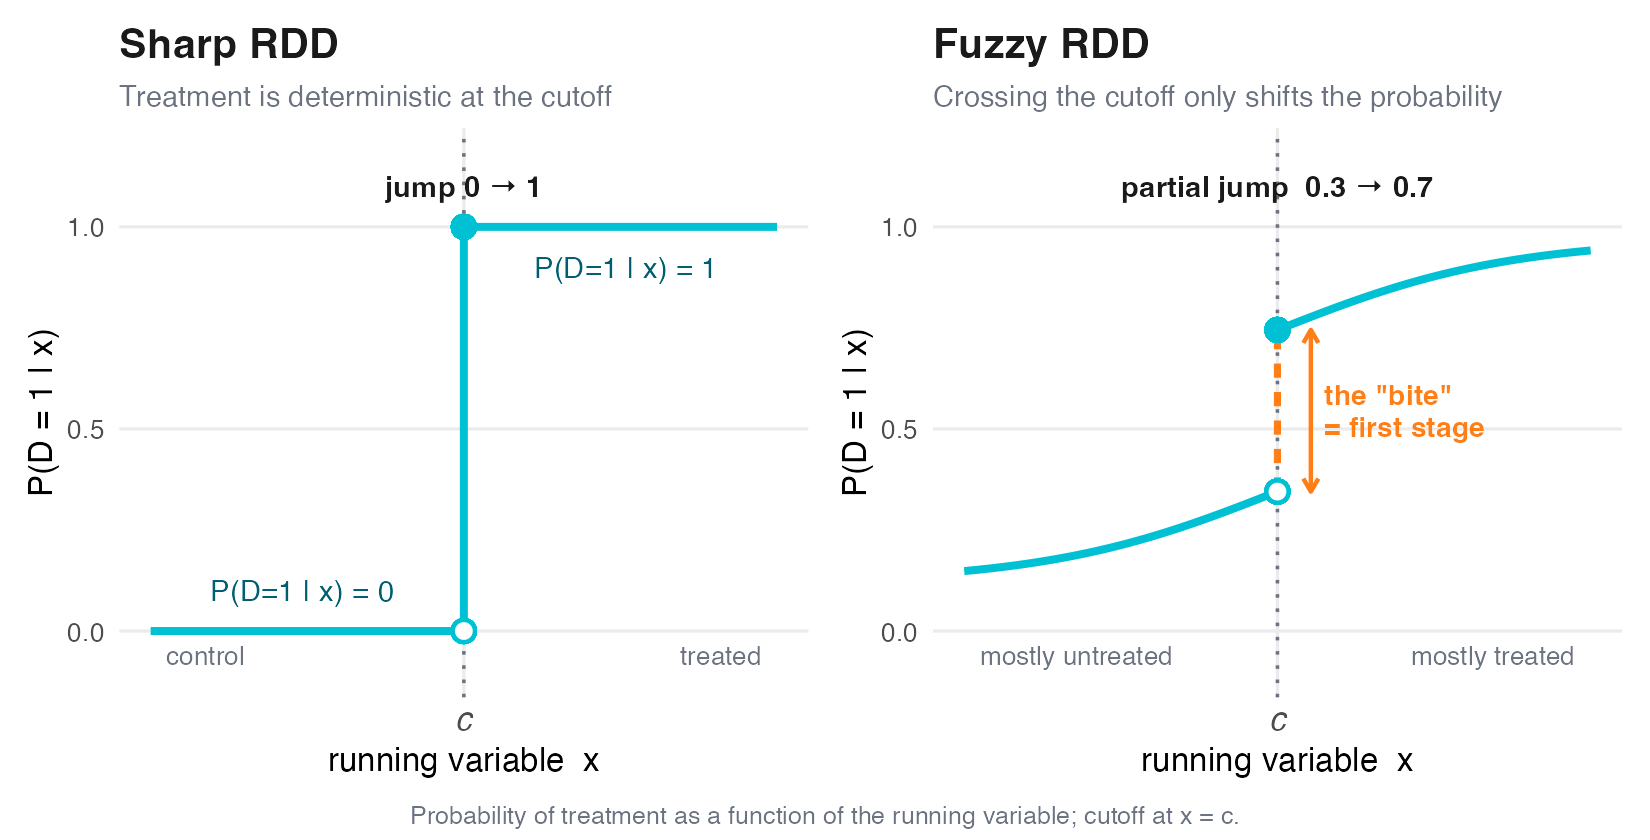
Sharp: treatment switches deterministically at \(c\) (probability \(0 \to 1\)). Then
\[\tau = \lim_{x\downarrow c}E[Y\mid x] - \lim_{x\uparrow c}E[Y\mid x] = E[Y_1 - Y_0 \mid x=c].\]
A treatment effect at the cutoff (Thistlethwaite and Campbell 1960).
Which design? A full \(0\to1\) step in \(E[D\mid x]\) → sharp; a partial jump → fuzzy.
Fuzzy RDD IS a local instrumental-variable design
When crossing \(c\) only changes the probability of treatment, instrument \(D\) with \(Z=\mathbb{1}\{x\ge c\}\):
\[\tau = \frac{\lim_{x\downarrow c}E[Y\mid x] - \lim_{x\uparrow c}E[Y\mid x]}{\lim_{x\downarrow c}E[D\mid x] - \lim_{x\uparrow c}E[D\mid x]} = \frac{\text{jump in } E[Y]}{\text{jump in } E[D]}.\]
Sharp = fuzzy with first stage \(=1\): full step in \(E[D\mid x]\) → sharp; partial → fuzzy.
It is a Wald ratio. Every word from Acts 1–2 carries over, evaluated at the cutoff:
| IV concept | Fuzzy-RDD version |
| Compliers | units who take treatment because they crossed \(c\) |
| Monotonicity | crossing \(c\) never discourages treatment |
| Exclusion | \(c\) affects \(Y\) only through \(D\) (smoothness) |
| Weak instrument | tiny jump in \(E[D]\) ⇒ unstable ratio |
Formalized by Hahn, Todd, and Van der Klaauw (2001).
RDD identifies a LOCAL effect — mind the external validity
What RDD recovers is a LATE at the cutoff — the effect for units sitting right at \(x=c\). Not a global ATE.
A $500 loyalty tier The effect of crossing the $500-spend threshold tells you about customers near $500.
A $5000 tier It says almost nothing about the effect of a premium tier at $5000 — different customers, different margins.
Same caveat, two senses
RDD is local in the complier sense (fuzzy: who responds to crossing \(c\)) and in the covariate sense (only units near \(c\)). Extrapolating to a different threshold is an assumption, not a finding.
The locality is intrinsic to the design (Lee and Lemieux 2010; Imbens and Lemieux 2008).
Estimate locally — do NOT fit high-order global polynomials

Do: local linear (or quadratic) fit inside a bandwidth around \(c\). Don’t: a single high-order polynomial across the whole range — it is noisy, lets far-away points dictate the fit at \(c\), and miscovers the truth (Gelman and Imbens 2019).
Validity threat 1: did units MANIPULATE the running variable?

If agents can precisely control \(x\) to land on the favorable side, the local-randomization story collapses. Test for a discontinuity in the density of \(x\) at \(c\) (McCrary 2008); modern binning-free version in Cattaneo, Jansson, and Ma (2020).
Caution: density tests can fail spuriously (heaping at round numbers). Use your eyes first, then a donut-hole around \(c\) (drop points at the line, re-estimate).
Validity threat 2: continuity / placebo checks
The smoothness assumption is partly testable — two placebo-style checks:
Covariate balance Pre-determined covariates (things fixed before treatment) should not jump at \(c\). A jump in, say, prior-year revenue means \(c\) is not as-good-as-random.
Fake cutoffs Run the same RDD at placebo thresholds where nothing happens. There should be no jump at \(c' \neq c\).
Diagnostic checklist for the lab
(1) density of \(x\) at \(c\) (manipulation) · (2) covariate jumps + fake cutoffs (continuity). Same two-threat taxonomy you will run on the FitLife fuzzy-RDD twist.
Use the tooling, not hand-rolled OLS
The RDD toolkit
rdrobust — data-driven MSE-optimal bandwidth (CCT, Calonico, Cattaneo, and Titiunik (2014)) plus robust bias-corrected confidence intervals, so the intervals are actually valid (Calonico et al. 2017). rddensity — the manipulation (McCrary-style) test.
A hand-rolled OLS with an arbitrary bandwidth gives a point estimate but invalid standard errors — bias from the local fit leaks into the CI. rdrobust corrects for exactly that.
Mechanics — CCT bandwidth selection, McCrary internals, polynomial order — live in the LAB and NOTES, not this lecture. Practical guide: Cattaneo, Idrobo, and Titiunik (2020).
RDD is everywhere tech has a threshold
| Threshold | Running variable \(x\) / cutoff \(c\) | Sharp or fuzzy? |
| Loyalty / rewards tiers | cumulative spend crosses a tier boundary | sharp — auto-enrolled |
| Ad-auction reserve prices | bid above/below reserve (Ostrovsky and Schwarz 2023) | sharp — mechanical |
| Search-rank boundaries | relevance score crosses a position cutoff (Narayanan and Kalyanam 2015) | sharp — rule-based |
| Credit-score gates | FICO crosses an approval threshold | fuzzy — underwriter discretion |
| Promo eligibility → opt-in | spend / tenure crosses an offer threshold | fuzzy — redemption is partial |
| Fraud / risk-score review | risk score crosses a review threshold | fuzzy — humans override |
RDD recovers a causal effect from logs when no clean A/B test was run — a complement to experimentation, local to the threshold.
Recap: one intuition, six designs, always a LOCAL effect
One idea — find exogenous variation you didn’t assign, then isolate it for a local effect on the units it moves.
One check protects each design family
Match each design to the one diagnostic that guards it:
| Design | Key diagnostic |
| IV / encouragement / judge | first-stage \(F\) (weak-instrument) |
| Shift-share (Bartik) | AKM / exposure-robust SEs |
| RDD (sharp / fuzzy) | McCrary density + bandwidth choice |
To the lab and Assignment III: FitLife, two treatments, one story
The lab uses a synthetic tech DGP: an encouragement IV plus a fuzzy-RDD twist. Assignment III bridges both halves of Part III — the SEND decision with S06 tools and the OPEN decision with S07 tools.
References
| Thank you for your attention! | |

 |
|
Causal Data Science for Business Analytics | 7. Instrumental Variable Designs