
6. Observed Confounding
Causal Data Science for Business Analytics
Christoph Ihl
Hamburg University of Technology
Monday, 1. June 2026
When Randomization Is Off The Table
Most business decisions are studied with observational data — so we have to act as if we randomized.
Where we are in the course — Part III opens with observed confounding
| Part | Theme | Identification assumption |
|---|---|---|
| I (S01–S03) | Causal language | Articulate a DAG; pick an adjustment set. |
| II (S04–S05) | Experiments | \(D\) is randomized by design \(\Rightarrow\) \(D \perp (Y(0), Y(1))\). |
| III (S06–S07) | (Un-)Observed confounding | S06 assumes all confounders are measured; S07 finds an exogenous instrument when they are not. |
| IV (S08–S09) | Causal ML | Same as S06 but with high-dim \(X\) and ML nuisances (DML). |
| V (S10–S12) | Panel data | Use repeated observations of the same unit; parallel trends, donor pool, factor model. |
S06 is the base case: observational data with a credible adjustment set. Everything after is either a relaxation (S07–S12) or a refinement (S08–S09) of today’s framework.
Assumption 1: Conditional Independence — the assumption behind “observed confounding”
\[(Y(1), Y(0)) \perp\!\!\!\perp D \mid \mathbf{X}\]
The same assumption appears in five disciplines under five names:
| Name | Used in | Read as |
|---|---|---|
| Conditional independence | Statistics | Potential outcomes are independent of \(D\) given \(\mathbf{X}\). |
| Unconfoundedness | Econometrics | \(\mathbf{X}\) contains every confounder. |
| Ignorability | Bayesian inference | The assignment mechanism can be ignored once \(\mathbf{X}\) is conditioned on. |
| Conditional exchangeability | Epidemiology | Treated and untreated are exchangeable within \(\mathbf{X}\)-strata. |
| Selection-on-observables | Labour econ. / sociology | Selection into \(D\) is fully explained by the observed \(\mathbf{X}\). |
Compare to S04: under randomization, \(D \perp (Y(0), Y(1))\) holds unconditionally. Today the independence holds conditional on \(\mathbf{X}\) — but only if \(\mathbf{X}\) is the right \(\mathbf{X}\).
DAG view — close every backdoor path with the right adjustment set
The canonical confounder triangle:
\(\mathbf{X}\) is a confounder: it has an arrow into both \(D\) and \(Y\).
Conditioning on \(\mathbf{X}\) closes the backdoor path:

Once \(\mathbf{X}\) is fixed, \(D\) varies as-if-randomly w.r.t. \(Y\).
Operational reading: “Find an \(\mathbf{X}\) that blocks every backdoor path from \(D\) to \(Y\).” The DAG tells you which covariates; the rest of today’s session is how to condition on them.
Confounder selection — “good and bad controls”
A DAG-naïve analyst will “control for everything observed” (Cinelli, Forney, and Pearl 2024). This is wrong: some covariates reduce bias, others add bias, and a few inject bias that wasn’t there.
| # | Structure | Verdict | Reason |
|---|---|---|---|
| M1 | \(D \leftarrow Z \rightarrow Y\) (classic confounder) | Good control | Closes the backdoor. |
| M2 | \(D \leftarrow A, A \rightarrow Z, Z \rightarrow Y\) | Good control | \(Z\) lies on the backdoor path \(D \leftarrow A \rightarrow Z \rightarrow Y\); conditioning on it (a descendant of the confounder \(A\)) blocks that path. |
| M3 | \(Z \rightarrow Y\) only (precision variable) | Good control | Doesn’t block bias; reduces residual variance. |
| M4 | \(D \rightarrow Z\) (post-treatment) | Bad control | Conditioning on a descendant of \(D\) blocks part of the causal effect. |
| M5 | \(D \rightarrow Z \leftarrow Y\) (collider on \(D, Y\)) | Bad control | Conditioning opens a non-causal path \(D \to Z \leftarrow Y\). |
| M6 | \(D \leftarrow U_1 \rightarrow Z \leftarrow U_2 \rightarrow Y\) (\(Z\) a collider of unmeasured \(U_1, U_2\)) | Bad control | “M-bias” — \(Z\) is a pre-treatment collider; conditioning on it opens the otherwise-closed path \(D \leftarrow U_1 \rightarrow Z \leftarrow U_2 \rightarrow Y\). |
| M7 | \(Z \rightarrow D\) only (instrument-like) | Neutral / risky | No bias reduction; amplifies bias from unobserved confounders. |
| M8 | Pre-treatment variables of unknown structure | Default include | “When in doubt, condition” applies only among pre-treatment variables and only if you cannot rule out M6 or M7. |
Assumption 2: Positivity — every unit has a chance of either treatment
\[0 < P(D = 1 \mid \mathbf{X} = \mathbf{x}) < 1 \quad \text{for every } \mathbf{x} \text{ in the support of } \mathbf{X}\]
Also called overlap or common support. The propensity score \(e(\mathbf{x}) = P(D=1 \mid \mathbf{X}=\mathbf{x})\) must lie strictly between 0 and 1 for every \(\mathbf{x}\) we want to make a statement about.
Why it matters: without overlap at some \(\mathbf{x}\), the analyst’s counterfactual for that \(\mathbf{x}\) is extrapolation — a model-based guess outside the observed sample. Two responses:
- Trim the sample to the overlap region (e.g. \(e \in [0.05, 0.95]\)) — (Crump et al. 2009)
- Redefine the estimand to weight units by \(e(1-e)\) (overlap weights) — a bounded-weight cousin of IPW: same family, different estimand — (Li, Morgan, and Zaslavsky 2018)
Diagnostic: plot the histogram of \(\hat e(\mathbf{X})\) separately for \(D=0\) and \(D=1\). If one tail has near-zero mass in one group, the ATE is identified only on the other group’s support.
Positivity at a glance — what good vs. broken overlap look like
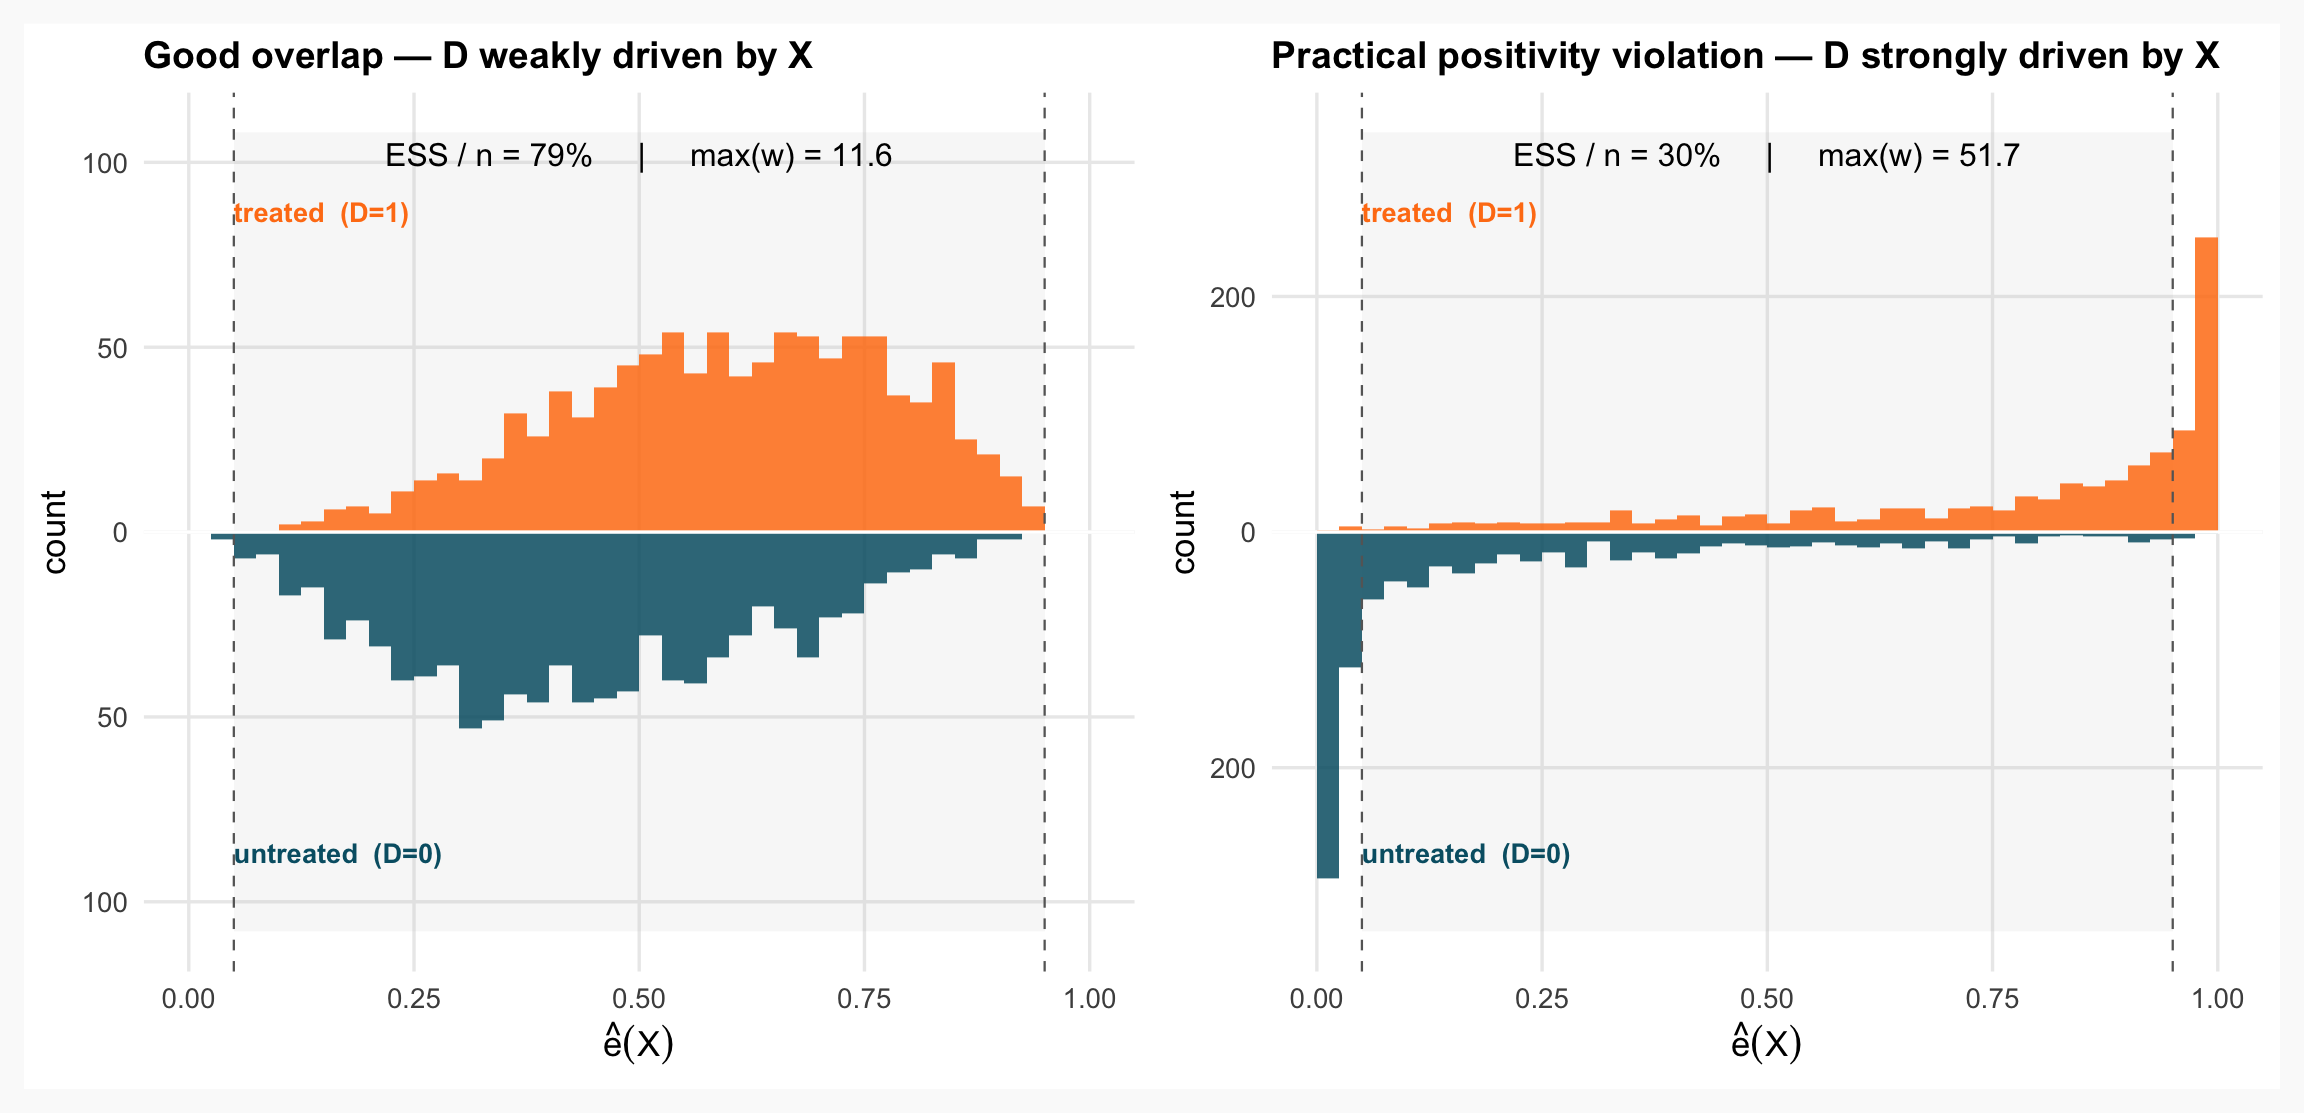
Three diagnostics in one picture. Each unit’s inverse-probability weight is \(w_i = 1/\hat e(\mathbf{x}_i)\) for treated, \(1/(1-\hat e(\mathbf{x}_i))\) for controls. (i) The mirrored histogram of \(\hat e(\mathbf{X})\) — treated above, untreated below — shows where common support holds and where it does not. (ii) ESS / n — the effective sample size \(\text{ESS} = (\sum w_i)^2 / \sum w_i^2\) (Kish), reported relative to \(n\) — collapses when a few units dominate the weights. (iii) max(\(w\)) flags the single most-influential unit. Dashed lines mark the Crump et al. (2009) trim region \([0.05, 0.95]\).
The identification theorem — three equivalent expressions for the ATE
Under Assumption 1 (conditional independence) and Assumption 2 (positivity), the ATE is identified from observed data — in three equivalent ways:
| Expression | Formula | Estimator strategy |
|---|---|---|
| Adjustment formula | \(\tau = \mathbb{E}_{\mathbf{X}}\!\left[\mathbb{E}(Y \mid D=1, \mathbf{X}) - \mathbb{E}(Y \mid D=0, \mathbf{X})\right]\) | Conditional outcome regression (OR) \(\Rightarrow\) matching or model the OR directly. |
| IPW | \(\tau = \mathbb{E}\!\left[\dfrac{D \, Y}{e(\mathbf{X})} - \dfrac{(1-D) Y}{1 - e(\mathbf{X})}\right]\) | Model the propensity \(e(\mathbf{X})\) \(\Rightarrow\) inverse-probability weighting. |
| AIPW | Combine the two with a residual correction (Stack 4). | Model both \(\Rightarrow\) doubly robust. |
Three roads to the same ATE. Each row is a separate estimation strategy that motivates one of the next three stacks (Matching → IPW → AIPW).
In population, all three expressions equal \(\tau\). In finite samples, they differ — and the difference comes from which model is misspecified. AIPW’s appeal: it’s consistent if either the OR model or the propensity model is right.
Why adjusted OLS alone is fragile under observational \(D\)
Recall S04: \(Y = \beta_0 + \beta_1 D + \boldsymbol\gamma^\top \mathbf{X} + \varepsilon\), fit by OLS, returns \(\hat\beta_1\) as the ATE under randomization. Under observational \(D\), three things break:
- Functional-form leak. \(\mathbb{E}(Y \mid D, X)\) is rarely linear-additive. If \(X\) enters non-linearly or interacts with \(D\) (heterogeneous effects), \(\hat\beta_1\) recovers a confounded variance-weighted average, not the ATE (Angrist and Pischke 2009).
- Extrapolation outside overlap. OLS projects \(\hat\beta_1\) onto the full support of \(X\) even when no treated unit exists at some \(X\). The estimate becomes a model-based extrapolation.
- Sensitivity to specification. Adding/removing one quadratic term can shift \(\hat\beta_1\) by 30%+ on real data. The “robustness checks” appendix of every empirical paper.
Stack 2 onwards: treat \(\mathbb{E}(Y \mid D, X)\) as a non-parametric object — match on \(X\), weight by \(e(X)\), or combine both — rather than imposing a single parametric form.
OLS does not disappear: in S04 it is the design-justified estimator under random assignment; in S06 it is the baseline and a building block (inside the OR component of AIPW). What changes is the burden of proof.
Conditioning on \(X\), animated — what adjustment actually does

Matching
Build a synthetic RCT by pairing each treated unit with its nearest counterfactual twin.
Matching idea — pair each treated unit with a comparable untreated unit
The adjustment formula, ATT version: \(\tau_{\text{ATT}} = \mathbb{E}\!\left[\mathbb{E}(Y \mid D=1, X) - \mathbb{E}(Y \mid D=0, X) \mid D=1\right]\).
Matching estimator (1:1, no replacement):
\[\hat\tau_{\text{ATT}} = \frac{1}{n_1}\sum_{i: D_i=1} \bigl(Y_i - Y_{m(i)}\bigr)\]
where \(m(i)\) is the index of unit \(i\)’s “nearest” untreated twin under some distance metric.
Three design choices define a matching algorithm:
- Distance — exact / Mahalanobis / propensity-based / CEM-coarsened
- Matching ratio — 1:1 / 1:M / variable-M with caliper
- Replacement — match-with-replacement reduces bias but inflates variance
For ATE rather than ATT, also match each untreated unit to its treated twin and average: \(\hat\tau_{\text{ATE}} = (n_1/n)\hat\tau_{\text{ATT}} + (n_0/n)\hat\tau_{\text{ATU}}\).
Matching, animated — pair each treated unit with its nearest control on \(X\)

Exact matching — the conceptual ideal, the curse of dimensionality
Exact matching pairs unit \(i\) with unit \(j\) only if \(\mathbf{X}_i = \mathbf{X}_j\) — coordinate-wise identical.
Why we’d love it: zero bias from the matching step itself. The only assumption needed is overlap.
Why we can’t use it in practice — the curse of dimensionality: with \(K\) binary covariates, \(2^K\) strata; with continuous covariates, the probability of an exact match is zero.
Concrete: 10 binary covariates → 1024 strata. Exact-matching all covariates in a medium-sized data set would leave nearly every treated unit without a twin; even the lab’s example exact match on just four binary covariates strands the continuous ones badly unbalanced.
Two responses:
- Approximate the match (Mahalanobis, propensity, CEM-coarsened) — accept some bias for sample coverage.
- Reduce to a scalar (propensity score, Stack 3) — match in 1-D rather than \(K\)-D.
Mahalanobis distance — covariance-scaled Euclidean
Mahalanobis distance between two covariate vectors:
\[d_M(\mathbf{X}_i, \mathbf{X}_j) = \sqrt{(\mathbf{X}_i - \mathbf{X}_j)^\top \hat\Sigma_X^{-1} (\mathbf{X}_i - \mathbf{X}_j)}\]
where \(\hat\Sigma_X\) is the sample covariance matrix of \(\mathbf{X}\).
Three properties:
- Scale-invariant — multiplying any covariate by 100 doesn’t change the distance.
- Decorrelates — distance treats correlated covariates as a single dimension.
- Continuous — works on continuous and ordinal \(\mathbf{X}\); ill-suited to categorical.
Bias-variance: Mahalanobis preserves more units than exact (lower variance) but accepts non-zero within-pair distance (some bias). Abadie and Imbens (2006) show that, after Mahalanobis matching, a regression bias-correction on the matched pairs — regressing out the residual within-pair covariate gap — further reduces bias.
Coarsened Exact Matching (CEM) — bin, then match exactly within bins
Iacus, King, and Porro (2012): bin each continuous covariate into a small number of strata, then do exact matching on the bins. Treated units in bins with no untreated unit (or vice versa) are pruned from the sample.
Example: age in years → age in 5-year bins {18–22, 23–27, …}; income → quintile.
The MIB property (Monotonic Imbalance Bounding): the user sets the maximum within-bin imbalance — formally the L1 distance between the treated and control covariate histograms, CEM’s native metric — via the coarsening width, so bias is bounded before the data are touched. Other methods (PSM, Mahalanobis) only let the analyst diagnose imbalance ex post.
The price is sample loss: aggressive coarsening preserves balance at the cost of pruning units; the estimand effectively becomes the ATT on the overlap region.
Software: MatchIt::matchit(method = "cem") in R (wraps the cem package); no canonical Python implementation — coarsen each covariate by hand (pandas.cut / qcut) and exact-match within bins, or call R from Python via rpy2.
CEM, animated — coarsen \(X\) into bins; a bounded gap survives inside each

1:M, replacement, caliper — the bias-variance dial
Three more design knobs, all on a bias–variance tradeoff:
| Design choice | Bias effect | Variance effect | Default |
|---|---|---|---|
| 1:M (M>1) matching | Higher (more imperfect matches per treated unit) | Lower (more data in each \(\hat\mu_0\)) | \(M \in \{2, 4\}\) |
| With replacement | Lower (each treated gets its actual nearest neighbour) | Higher (some controls appear in many pairs) | Yes |
| Caliper \(c\) | Lower (drops matches with \(d > c\)) | Higher (smaller matched sample) | \(c = 0.2 \cdot \sigma_{\text{logit}(e)}\) |
Caliper rule of thumb (Rosenbaum and Rubin 1985): caliper = 0.2 × the standard deviation of the logit of the propensity score. Drops units with no acceptable twin within that range.
Modern practice: match with replacement + 1:M (\(M=4\)) + caliper 0.2; report the number of unique controls used and the share of treated units that found a match within the caliper.
Balance diagnostics — the standardized mean difference and the Love plot
Standardized mean difference for covariate \(X_k\) after matching:
\[\text{SMD}_k = \frac{\bar X_{k,1} - \bar X_{k,0}}{\sqrt{(s_{k,1}^2 + s_{k,0}^2)/2}}\]
Rule of thumb: \(|\text{SMD}_k| < 0.10\) = balance achieved (Stuart 2010).
The Love plot shows each covariate’s absolute SMD before vs. after matching — cobalt::love.plot(): one row per covariate, dashed line at 0.10. Richer checks — variance ratio, K-S — come next.

Beyond the mean — variance ratio and K-S
SMD compares means only. The same Love plot, with a different statistic, checks more:
- Variance ratio \(s_{k,1}^2 / s_{k,0}^2 \in [0.5, 2]\) — the second moment (spread); means can match while variances don’t.
- K-S statistic — the largest gap between the two covariates’ CDFs — the whole marginal distribution (shape, skew, multimodality).
love.plot(stats = c("variance.ratios", "ks.statistics")). Here spread is fine everywhere (ratios near 1), but income is flagged on K-S too — its whole distribution is shifted, not just its mean. Today’s lab stays on SMD.

Propensity score — Rosenbaum–Rubin’s dimensionality reduction trick
Propensity score = \(e(\mathbf{X}) = P(D = 1 \mid \mathbf{X})\) — the conditional probability of treatment.
Rosenbaum–Rubin (1983) balancing-score theorem:
Theorem
If \((Y(0), Y(1)) \perp D \mid \mathbf{X}\), then \((Y(0), Y(1)) \perp D \mid e(\mathbf{X})\).
Translation: conditioning on the scalar \(e(\mathbf{X})\) achieves the same balance as conditioning on the full vector \(\mathbf{X}\) (Rosenbaum and Rubin 1983).

\(e(\mathbf{X})\) is a sufficient statistic for \(\mathbf{X}\) as a confounder: it absorbs every backdoor that \(\mathbf{X}\) does.
Why it matters operationally: match in 1-D instead of \(K\)-D. Curse of dimensionality, dodged.
Propensity score matching — match on \(\hat e\), not on \(\mathbf{X}\)
Three steps:
- Estimate the propensity score. Fit a binary-choice model: \(\hat e(\mathbf{x}) = \Lambda(\hat\beta_0 + \hat{\boldsymbol\beta}^\top \mathbf{x})\) where \(\Lambda\) is logit (or probit, or — modern — gradient-boosted trees / a neural net).
- Match on \(\hat e\). Each treated unit’s twin is the untreated unit with the closest \(\hat e\) (1:1) or the \(M\) closest (1:M, optionally with caliper).
- Estimate \(\hat\tau_{\text{ATT}}\) by averaging the paired differences. For the SE, use the Abadie–Imbens (2006) analytic variance, or matched-set cluster-robust SEs on the matched-sample regression — not plain HC1 or the naïve bootstrap (see the inference slide).
This was the dominant matching method from 1983 (Rosenbaum–Rubin) to ~2019. Then King & Nielsen published a paper that changed the consensus.
PSM and its discontents — King & Nielsen 2019
“Why Propensity Scores Should Not Be Used for Matching” (Political Analysis, 2019)
King and Nielsen (2019) show, both theoretically and via simulation, that propensity score matching can increase imbalance relative to no matching, because matching on \(\hat e\) approximates random sampling within strata of \(\hat e\) — which has nothing to do with covariate-level balance.
Three takeaways for practitioners:
- PSM imitates a completely randomized experiment, not a fully blocked one. In a complete-RCT, covariates are balanced in expectation, not in every sample.
- CEM and Mahalanobis imitate a fully blocked experiment — covariate balance is enforced sample by sample.
- The “propensity score paradox”: the better your PSM model fits, the more it converges to random matching within strata, and the worse your covariate balance can get.
Operational rule: prefer covariate-space matching (CEM or Mahalanobis) over PSM for matching — but choose between them by checking both balance and retained-sample representativeness: CEM can over-prune (as in today’s Lalonde lab), in which case Mahalanobis is the better choice. Reserve the propensity score for weighting (Stack 3) and AIPW (Stack 4), where its mathematical role is different.
Estimation after matching — what works, what doesn’t
The point estimate is easy — the (weighted) average paired difference. The standard error is the subtle part: the matched sample is constructed, not an i.i.d. draw.
Does not work:
- ❌ Naïve t-test — matched pairs aren’t i.i.d.; they share controls.
- ❌ Naïve bootstrap of the matching procedure — not consistent for matching SEs (Abadie and Imbens 2008).
- ❌ Plain HC1 on the matched sample — treats it as i.i.d.; inconsistent, and errs in either direction (Abadie and Spiess 2022).
Works — two valid routes:
- ✅ Abadie–Imbens analytic SEs — a matching-aware variance.
- ✅ Matched-sample regression + matched-set cluster-robust SEs.
How the two relate, and how to run them — next.
Two valid routes to the SE — same estimand, complementary checks
Same estimand, same probability limit → two complete (estimator + SE) packages. Pick one to report; run both as a robustness check. Don’t mix the parts — or fall back to HC1.
A · Abadie–Imbens (matching-aware)
Matching-imputation + a regression bias-correction — subtract the predicted gap \(\hat\mu(\mathbf{X}_i) - \hat\mu(\mathbf{X}_{m(i)})\) (gap × slope) + the AI analytic variance.
B · Matched-sample regression
Weighted \(Y \sim D + \mathbf{X}\) on the matched data — adding \(\mathbf{X}\) regresses out residual imbalance — + matched-set cluster-robust SEs.
Caveat: CEM isn’t in the Matching package, so route A covers exact / Mahalanobis / PSM.
Inverse Probability Weighting
Weight every observation by 1 / its probability of being where it is — and the sample becomes as-if-randomized.
Concretely: where treatment is rare (\(\hat e = 0.2\)), up-weight each treated unit by \(1/0.2 = 5\) so it stands in for the four like it — rebuilding the pseudo-population.
IPW theorem — Horvitz–Thompson reweighting recovers the ATE
Theorem (Horvitz–Thompson)
Under conditional independence (\(Y(0), Y(1) \perp D \mid \mathbf{X}\)) and positivity (\(0 < e(\mathbf{X}) < 1\)):
\[\tau_{\text{ATE}} = \mathbb{E}\!\left[\frac{D \, Y}{e(\mathbf{X})} - \frac{(1-D) \, Y}{1 - e(\mathbf{X})}\right]\]
Proof sketch (for the \(\mathbb{E}[Y(1)]\) piece):
\[\mathbb{E}\!\left[\frac{D \, Y}{e(\mathbf{X})}\right] = \mathbb{E}\!\left[\mathbb{E}\!\left(\frac{D \, Y(1)}{e(\mathbf{X})} \,\bigg|\, \mathbf{X}\right)\right] = \mathbb{E}\!\left[\frac{\mathbb{E}(D \mid \mathbf{X}) \, \mathbb{E}(Y(1) \mid \mathbf{X})}{e(\mathbf{X})}\right] = \mathbb{E}[\mathbb{E}(Y(1) \mid \mathbf{X})] = \mathbb{E}[Y(1)]\]
Sample estimator: plug in \(\hat e(\mathbf{X}_i)\):
\[\hat\tau_{\text{ATE}}^{\text{HT}} = \frac{1}{n}\sum_{i=1}^n \frac{D_i Y_i}{\hat e(\mathbf{X}_i)} - \frac{1}{n}\sum_{i=1}^n \frac{(1-D_i) Y_i}{1 - \hat e(\mathbf{X}_i)}\]
Hájek (normalized) IPW — same idea, smaller variance
The Horvitz–Thompson estimator divides by \(n\). The Hájek version divides by the sum of weights:
\[\hat\tau_{\text{ATE}}^{\text{Hájek}} = \frac{\sum_i D_i Y_i / \hat e_i}{\sum_i D_i / \hat e_i} - \frac{\sum_i (1-D_i) Y_i / (1-\hat e_i)}{\sum_i (1-D_i) / (1-\hat e_i)}\]
Why Hájek is preferred in practice:
- Lower variance when weights are skewed (almost always): HT divides by a fixed \(n\), so one giant \(1/\hat e_i\) inflates the mean; Hájek self-normalizes — dividing by the realized \(\sum_i D_i/\hat e_i\) — so numerator and denominator inflate together and partly cancel.
- Each arm-mean is a weighted average of observed \(Y\) — so each lies in \([\min Y, \max Y]\) (the flip side of that cancellation); the HT arm-means do not.
- Invariant to shifting \(Y\) by a constant.
Bias-variance: HT is unbiased but high-variance; Hájek’s tiny \(O(1/n)\) bias — negligible beside its own \(O(1/\sqrt n)\) SE — buys much lower variance and lower MSE. The practical default.
Diagnostics — weight tails, ESS, trimming
When \(\hat e(\mathbf{X}_i) \to 0\) or \(\to 1\) for some \(i\), the inverse weight \(\to \infty\) — a single observation can dominate the estimator.
Three diagnostics:
| Diagnostic | Formula | Action threshold |
|---|---|---|
| Max / min weight | \(\max_i w_i\) and \(\min_i w_i\) | Investigate any \(w_i > 10\) or \(> 0.1n\). |
| Effective sample size |
\(\text{ESS} = \big(\sum_i w_i\big)^2 / \sum_i w_i^2\) i.i.d.-equivalents: ESS = 0.5n ⇒ 1000 rows carry the info of 500 equally-weighted obs. |
ESS \(< 0.5n\) ⇒ heavy concentration. |
| Propensity histogram | \(\hat e(\mathbf{X}_i)\) by group \(D\) | Near-zero mass for either tail ⇒ trim. |
Trimming rule: drop units with \(\hat e \notin [\alpha, 1-\alpha]\), typically \(\alpha = 0.05\) or \(0.1\). The estimand becomes the ATE on the overlap region; report this change transparently (Crump et al. 2009).
Modern alternative — overlap weights: weight by \(e(1-e)\) instead of \(1/e\) or \(1/(1-e)\). No discontinuous trimming; the weight smoothly down-weights extreme propensities (Li, Morgan, and Zaslavsky 2018).
IPW weights, made visual — a heavy tail is a positivity failure

Modern balancing weights — enforce-by-design
Standard IPW: fit a propensity model \(\hat e(\mathbf{X})\) → invert → check balance ex post — the weighted Love plot / SMD check from Stack 2, now on the weighted sample. If balance is bad, re-specify and try again.
Modern alternative (Athey and Imbens 2017): enforce balance as weight constraints rather than ex-post from a fitted model.
| Method | Idea — the constrained weight problem |
|---|---|
|
Entropy balancing (Hainmueller 2012) · ebal, WeightIt
|
Balance becomes a hard constraint, not a hope: the weights reproduce the treated covariate means exactly. Among all weightings that do, the max-entropy objective (minimize negentropy = minimize KL-from-uniform) picks the one closest to uniform — disturbing the sample as little as balance allows. \(\min_w \sum_i w_i \log w_i \;\;\text{s.t.}\;\; \sum_i w_i \mathbf{X}_i = \bar{\mathbf{X}}_{\text{treat}}\) |
|
Covariate balancing PS (Imai and Ratkovic 2014) · CBPS
|
Ordinary logistic PS maximizes fit to who got treated — good prediction, but not necessarily good balance. CBPS estimates the same score while adding balance as a moment condition, so one model does double duty: predict treatment and equalize covariate means (solved by GMM). \(\sum_i\!\big(\tfrac{D_i}{\hat e_i}-\tfrac{1-D_i}{1-\hat e_i}\big)\mathbf{X}_i = 0\) |
|
Stable balancing weights (Zubizarreta 2015) · sbw
|
The mirror image of entropy balancing: instead of exact balance at any cost, you cap the tolerable imbalance \(\delta\) and the solver returns the least-variable weights that stay inside it. Minimizing weight spread keeps the effective sample large — dialing bias (\(\delta\)) against variance directly. \(\min_w \sum_i w_i^2 \;\;\text{s.t.}\;\; \big|\sum_i w_i \mathbf{X}_i - \bar{\mathbf{X}}_{\text{target}}\big| \le \delta\) |
Doubly Robust: AIPW
Combine the outcome model and the propensity model — and get two chances to be right.
AIPW idea — augment the OR, or augment the IPW
Ingredients: outcome regression \(\hat\mu_d(\mathbf{x}) = \hat{\mathbb{E}}(Y \mid D{=}d, \mathbf{X}{=}\mathbf{x})\) and propensity score \(\hat e(\mathbf{x}) = \hat P(D{=}1 \mid \mathbf{X}{=}\mathbf{x})\). The same estimator regroups two equivalent ways (Robins, Rotnitzky, and Zhao 1994):
(A) Augment the OR — adjustment formula, corrected by an IPW-weighted residual:
\[\hat\tau_{\text{AIPW}} = \frac{1}{n}\sum_i\Big[\,\underbrace{\hat\mu_1 - \hat\mu_0}_{\text{OR difference}} \;+\; \underbrace{\tfrac{D_i(Y_i-\hat\mu_1)}{\hat e} - \tfrac{(1-D_i)(Y_i-\hat\mu_0)}{1-\hat e}}_{\text{IPW correction on the OR residual}}\,\Big]\]
OR right ⇒ residuals are mean-zero ⇒ a wrong PS does no harm.
(B) Augment the IPW — Horvitz–Thompson, corrected by the outcome model:
\[\hat\tau_{\text{AIPW}} = \frac{1}{n}\sum_i\Big[\,\underbrace{\tfrac{D_i Y_i}{\hat e} - \tfrac{(1-D_i)Y_i}{1-\hat e}}_{\text{IPW (Horvitz–Thompson)}} \;-\; \underbrace{(D_i-\hat e)\big(\tfrac{\hat\mu_1}{\hat e} + \tfrac{\hat\mu_0}{1-\hat e}\big)}_{\text{OR correction}}\,\Big]\]
PS right ⇒ \(D_i-\hat e\) is mean-zero ⇒ a wrong OR does no harm.
Double robust — consistent if either model is right
Theorem (Double Robustness)
Under conditional independence and positivity, \(\hat\tau_{\text{AIPW}} \xrightarrow{p} \tau_{\text{ATE}}\) if either:
- \(\hat\mu_d \xrightarrow{p} \mu_d\) (OR correctly specified), or
- \(\hat e \xrightarrow{p} e\) (PS correctly specified) — or both.
Proof intuition. The bias of AIPW decomposes:
\[\mathbb{E}[\hat\tau_{\text{AIPW}}] - \tau = \mathbb{E}\!\left[\underbrace{\left(\frac{e - \hat e}{\hat e}\right)}_{\text{PS error}} \cdot \underbrace{(\mu_1 - \hat\mu_1)}_{\text{OR error}}\right] + (\text{symmetric for } d=0)\]
The bias is the product of the two errors — small if either factor is small.
Failure mode: if both are wrong, AIPW is biased — “two chances”, not bullet-proof. And both chances live inside conditional independence (same \(\mathbf{X}\)): an omitted confounder breaks both at once. DR guards functional form, not identification → Sensitivity Analysis.
AIPW inference — the influence function gives the SE
AIPW is asymptotically linear: \(\hat\tau \approx \tau + \tfrac{1}{n}\sum_i \psi(O_i)\) with \(\mathbb{E}[\psi]=0\). The influence function \(\psi(O_i)\) is how much one observation moves the estimate; the CLT then gives \(\sqrt n\,(\hat\tau-\tau)\xrightarrow{d} N\!\big(0,\,\mathbb{E}[\psi^2]\big)\).
For AIPW, \(\psi\) is just the centered per-unit contribution from the estimator — its efficient influence function (which is why AIPW attains the efficiency bound (Hirano, Imbens, and Ridder 2003)):
\[\hat\psi_i = \underbrace{\hat\mu_1 - \hat\mu_0 + \tfrac{D_i(Y_i-\hat\mu_1)}{\hat e} - \tfrac{(1-D_i)(Y_i-\hat\mu_0)}{1-\hat e}}_{i\text{-th AIPW contribution}} \;-\; \hat\tau\]
\[\widehat{\operatorname{SE}}(\hat\tau_{\text{AIPW}}) \;=\; \frac{\operatorname{sd}(\hat\psi_i)}{\sqrt n}\]
the spread of the per-unit contributions, over \(\sqrt n\) — no delta method. (Ex 3 bootstraps it; econml.dr.LinearDRLearner returns it analytically.)
Double robustness, visualized — the CI covers the truth whenever one model is right

AIPW’s CI covers the truth (teal) wherever one model is right — A, B, and C — missing only D; IPW-alone covers A/B, OR-alone A/C. DR = teal in three panels of four.
Bridge to S08 — AIPW + cross-fitting + ML nuisances = DML
AIPW with logistic PS and linear OR is the classical setup — but on the full sample, fitting and evaluating the nuisances on the same rows makes CIs run too narrow when the nuisances have many covariates (large \(K\)). Three modern moves fix this:
- ML nuisances — replace logistic PS with random forest, gradient boosting, neural net; replace linear OR with the same. Each ML estimator converges slowly (often at rate \(n^{-1/4}\)), but the product of their errors vanishes at rate \(n^{-1/2}\) — fast enough for valid \(\sqrt{n}\) inference. That product structure is what cross-fitted AIPW exploits.
- Cross-fitting — split sample, fit nuisances on one half, evaluate on the other (and rotate). Removes the fit-and-evaluate bias above, so the CIs are honest again (Chernozhukov et al. 2018).
- Inference — Neyman-orthogonal score functions deliver valid \(\sqrt{n}\)-CIs even with ML nuisances.
Together = Double Machine Learning (DML) — the topic of S08. AIPW is its building block.
For S06 today: stay with parsimonious parametric nuisances. The DR property gives you robustness for free.
Sensitivity Analysis
Assumption 1 is untestable. How wrong would you have to be to flip your conclusion?
The problem — unconfoundedness is untestable

\(U\) is the unobserved confounder — same structural role as \(X\), but absent from the dataset.
The honest analyst’s question: our AIPW worked example gave \(\hat\tau = 2.0\), \(\text{CI} = (1.4, 2.6)\) — but that assumed \(\mathbf{X}\) held every confounder. If an unobserved \(U\) was lurking, how far could it shift this?
Three answers, each from a different framework:
- Rosenbaum bounds (Γ) — matching-flavoured; \(U\)’s effect on treatment assignment.
- E-value — simple risk-ratio threshold; \(U\)’s effect on D and on Y.
- sensemakr — OLS-flavoured; partial-\(R^2\) benchmark against observed covariates.
The shift: from “is the assumption right?” (unanswerable) to “how strong would the violation have to be?” (answerable, in three different metrics).
Rosenbaum bounds — how much hidden bias is the result robust to?
Setup (Rosenbaum 2002): assume two units \(i\) and \(j\) are matched (identical \(\mathbf{X}\)). Their odds of treatment may still differ due to an unobserved \(U\):
\[\frac{1}{\Gamma} \leq \frac{P(D_i = 1 \mid \mathbf{X}_i = \mathbf{x}, U_i) / P(D_i = 0 \mid \mathbf{X}_i = \mathbf{x}, U_i)}{P(D_j = 1 \mid \mathbf{X}_j = \mathbf{x}, U_j) / P(D_j = 0 \mid \mathbf{X}_j = \mathbf{x}, U_j)} \leq \Gamma\]
In words: within a matched pair, treatment odds can differ by up to a factor \(\Gamma\) due to \(U\); \(\Gamma = 1\) means no hidden bias.
Sensitivity output: the largest \(\Gamma\) at which the matched-pair test (e.g. Wilcoxon signed-rank) still rejects — bigger \(\Gamma\) = more robust.
Interpretation benchmark for \(\Gamma\):
| \(\Gamma\) | Reading |
|---|---|
| 1.0 | No hidden bias allowed. |
| 1.25 | A 25% shift in within-pair treatment odds would overturn the result — weak. |
| 2.0 | Hidden bias would have to double the odds of treatment — strong. |
| \(\geq\) 3 | Highly robust; result survives substantial hidden bias. |
Rosenbaum bounds, visualized — the tipping point Γ*

As Γ rises the worst-case p-value crosses α at Γ* ≈ 1.9. Illustrative moderate-effect matched-pair scenario — a strong effect would stay significant past Γ = 10.
Software: rbounds, sensitivitymv (R, with MatchIt). Γ is matched-pairs only — for AIPW, use the E-value & sensemakr instead.
E-values (VanderWeele and Ding 2017) — starting from risk ratios
A risk ratio (RR) compares the rate of the outcome under treatment to the rate under control. Its natural home is a binary business outcome — did a customer convert, churn, click? Take an email campaign:
\[\widehat{\text{RR}}=\frac{P(\text{convert}\mid \text{treated})}{P(\text{convert}\mid \text{control})}=\frac{0.18}{0.09}=\mathbf{2.0}.\]
18% of treated customers convert vs. 9% of controls: treatment doubles the conversion rate. Read it directly — \(\text{RR}=1\) means no effect; \(\text{RR}=2\) means twice the rate; \(\text{RR}=0.5\) means half.
But our outcomes are usually continuous (revenue, time-on-site, the ATE \(\hat\tau\)). No native “risk” — so standardize (\(d=\hat\tau/\mathrm{SD}(Y)\), the standardized mean difference) and convert through the odds ratio:
\[\widehat{\text{RR}}\;\approx\;\underbrace{\sqrt{\widehat{\text{OR}}}}_{\text{OR}\,\to\,\text{RR}}\;\approx\;\exp\!\Big(\tfrac12\cdot\underbrace{\tfrac{\pi}{\sqrt3}}_{\approx\,1.81}\,d\Big)\;=\;\exp(0.91\,d).\]
Example: \(\hat\tau=1.52,\ \mathrm{SD}(Y)=2.0 \Rightarrow d=0.76 \Rightarrow \widehat{\text{RR}}\approx\exp(0.91\times0.76)\approx\mathbf{2.0}\) — the same scale, from a continuous estimate.
The E-value: the worst-case \(U\) on that RR scale
The E-value is the minimum strength of association — on that same RR scale — an unmeasured \(U\) would need with both the treatment and the outcome to pull the observed \(\widehat{\text{RR}}\) all the way down to 1 (explain the whole effect away) (VanderWeele and Ding 2017). It is a worst case: any \(U\) weaker than \(E\) on either arm cannot null the result.
\[E = \widehat{\text{RR}} + \sqrt{\widehat{\text{RR}}\bigl(\widehat{\text{RR}} - 1\bigr)}\quad(\widehat{\text{RR}}>1)\,;\qquad \underbrace{\widehat{\text{RR}}=2.0}_{\text{from the campaign}} \;\Rightarrow\; E = 2+\sqrt{2} \approx \mathbf{3.41}.\]
For \(\widehat{\text{RR}} < 1\): replace \(\widehat{\text{RR}}\) by \(1/\widehat{\text{RR}}\) first. One line of code: EValue::evalues.RR(2.0).
| \(\widehat{\text{RR}}\) | E-value | Reading |
|---|---|---|
| 1.2 (small effect) | 1.69 | A modest \(U\) could explain it away. |
| 2.0 (our campaign) | 3.41 | \(U\) would need \(\text{RR}_{UD}\) and \(\text{RR}_{UY}\) both ≥ 3.41. |
| 3.0 (large) | 5.45 | Very robust — \(U\) rarely this strong in practice. |
For scale: ≈1.5 weak (many plausible \(U\) clear it) · 3+ strong · 5+ exceptional (smoking → lung cancer: RR ≈ 10, E ≈ 19).
Why it caught on: no model assumed · worst-case (a weaker \(U\) cannot explain the effect away) · one line of code. But: \(E\) tells you how strong a \(U\) must be, not whether one that strong is plausible — sensemakr (next) benchmarks that against your observed covariates.
sensemakr — Cinelli & Hazlett’s partial-\(R^2\) framework
Cinelli and Hazlett (2020): a sensitivity framework built for linear regression (or AIPW with linear OR), parametrized by partial \(R^2\):
- \(R^2_{Y \sim U \mid D, X}\) — how much residual variance in \(Y\) would \(U\) explain, given \(D\) and \(X\)?
- \(R^2_{D \sim U \mid X}\) — how much residual variance in \(D\) would \(U\) explain, given \(X\)?
Two summary statistics:
- Robustness Value (RV) — the value \(R^2_{Y \sim U \mid D, X} = R^2_{D \sim U \mid X}\) at which the point estimate would be reduced to a threshold (e.g., zero, or a clinically meaningful boundary).
- RV-α — the value at which the t-statistic of \(\hat\tau\) would no longer reject at level \(\alpha\).
The killer feature — benchmarking. Compare RV against the partial-\(R^2\) of named observed covariates: “\(U\) would have to be at least \(k\) times stronger than the most predictive observed control (age, say) to flip the result.” Suddenly the abstract number is interpretable.
The contour plot — how strong must \(U\) be to overturn the result?

Axes: partial \(R^2\) a \(U\) would need with the treatment (x) and the outcome (y). Contours: the \(D\)-effect after adjusting for such a \(U\).
▲ = restricted estimate (\(X_2\) withheld): 2.71, biased up from 2.0. Red dashed = where the effect hits 0 (far corner only).
Benchmark (◆): a \(U\) as strong as \(X_1\) still leaves 1.48; \(2\times\to0.84\); \(3\times\to\) 0.22 — all positive. (◆ ride the top: \(X_1\) alone nearly maxes the outcome \(R^2\).)
Read — robust: RV = 0.54 — a \(U\) must be ~4–5× as predictive of treatment as the dominant \(X_1\) (\(0.54 \div 0.12\)) to reach 0; on the outcome side \(X_1\) already exceeds it.
Report (Cinelli–Hazlett): estimate + CI · RV · benchmark multiplier · contour · one-paragraph verdict. sensemakr(fit, treatment = "D", benchmark_covariates = "X1")
When sensitivity isn’t enough — pivot to a design-based strategy
Sensitivity analysis is a transparency tool, not a fix. If the robustness value is too low, the data don’t support a robust observational claim. Options:
| Approach | Session | When to reach for it |
|---|---|---|
| Instrumental variables | S07 | There’s an exogenous variable that shifts \(D\) but is plausibly excluded from the \(Y\) equation. |
| RDD | S07 | \(D\) is assigned by a threshold on an observed running variable. |
| Diff-in-diff | S10 | You have repeated observations of the same unit before and after treatment. |
| Synthetic control | S11 | Aggregate-level treatment, one or a few treated units, long pre-period. |
The rule: report sensitivity for any observational estimate, regardless of how confident you are. The number tells the reader where the estimate lives — and if it lives somewhere fragile, the next session in this list is the route forward.
Workflow
Identify, estimate, balance, stress-test — and pre-register the order.
The observed-confounding pipeline
| # | Step | Today’s tools | Output |
|---|---|---|---|
| 1 | Articulate the DAG | dagitty, ggdag | Adjustment set; flagged good/bad controls. |
| 2 | Check overlap | Propensity histogram, trimming rule | Subset to overlap region; report excluded units. |
| 3 | Choose estimator | CEM / Mahalanobis / IPW / AIPW | \(\hat\tau\), \(\widehat{\text{SE}}\), \(\text{CI}\). |
| 4 | Verify balance | cobalt::love.plot, SMD < 0.10 | Love plot + SMD table for every covariate. |
| 5 | Stress-test | Rosenbaum bounds, E-value, sensemakr | RV + benchmark + contour plot. |
The discipline: lock steps 1–3 before you unblind \(Y\). Step 4 is a no-regret check; step 5 is mechanical — both fully determined by 1–3.
Pre-register it. With \(K\) analytical choices there are \(2^K\) defensible paths, and the best-looking one is biased (Gelman and Loken 2014). A minimal pre-analysis plan locks: (1) DAG + adjustment set, (2) estimator + nuisance form, (3) trimming / caliper rule, (4) inference + sensitivity benchmarks — filed on OSF or EGAP before touching \(Y\).
References
Abadie, Alberto, and Guido W. Imbens. 2006. “Large Sample Properties of Matching Estimators for Average Treatment Effects.” Econometrica 74 (1): 235–67. https://doi.org/10.1111/j.1468-0262.2006.00655.x.
———. 2008. “On the Failure of the Bootstrap for Matching Estimators.” Econometrica 76 (6): 1537–57. https://doi.org/10.3982/ECTA6474.
Abadie, Alberto, and Jann Spiess. 2022. “Robust Post-Matching Inference.” Journal of the American Statistical Association 117 (538): 983–95. https://doi.org/10.1080/01621459.2020.1840383.
Angrist, Joshua D., and Jörn-Steffen Pischke. 2009. Mostly Harmless Econometrics: An Empiricist’s Companion. Princeton University Press.
Athey, Susan, and Guido W. Imbens. 2017. “The State of Applied Econometrics: Causality and Policy Evaluation.” Journal of Economic Perspectives 31 (2): 3–32. https://doi.org/10.1257/jep.31.2.3.
Chernozhukov, Victor, Denis Chetverikov, Mert Demirer, Esther Duflo, Christian Hansen, Whitney Newey, and James Robins. 2018. “Double/Debiased Machine Learning for Treatment and Structural Parameters.” The Econometrics Journal 21 (1): C1–68. https://doi.org/10.1111/ectj.12097.
Cinelli, Carlos, Andrew Forney, and Judea Pearl. 2024. “A Crash Course in Good and Bad Controls.” Sociological Methods & Research 53 (3): 1071–1104. https://doi.org/10.1177/00491241221099552.
Cinelli, Carlos, and Chad Hazlett. 2020. “Making Sense of Sensitivity: Extending Omitted Variable Bias.” Journal of the Royal Statistical Society: Series B 82 (1): 39–67. https://doi.org/10.1111/rssb.12348.
Crump, Richard K., V. Joseph Hotz, Guido W. Imbens, and Oscar A. Mitnik. 2009. “Dealing with Limited Overlap in Estimation of Average Treatment Effects.” Biometrika 96 (1): 187–99. https://doi.org/10.1093/biomet/asn055.
Gelman, Andrew, and Eric Loken. 2014. “The Statistical Crisis in Science.” American Scientist 102 (6): 460–65. https://doi.org/10.1511/2014.111.460.
Hainmueller, Jens. 2012. “Entropy Balancing for Causal Effects: A Multivariate Reweighting Method to Produce Balanced Samples in Observational Studies.” Political Analysis 20 (1): 25–46. https://doi.org/10.1093/pan/mpr025.
Hirano, Keisuke, Guido W. Imbens, and Geert Ridder. 2003. “Efficient Estimation of Average Treatment Effects Using the Estimated Propensity Score.” Econometrica 71 (4): 1161–89. https://doi.org/10.1111/1468-0262.00442.
Iacus, Stefano M., Gary King, and Giuseppe Porro. 2012. “Causal Inference Without Balance Checking: Coarsened Exact Matching.” Political Analysis 20 (1): 1–24. https://doi.org/10.1093/pan/mpr013.
Imai, Kosuke, and Marc Ratkovic. 2014. “Covariate Balancing Propensity Score.” Journal of the Royal Statistical Society: Series B 76 (1): 243–63. https://doi.org/10.1111/rssb.12027.
King, Gary, and Richard Nielsen. 2019. “Why Propensity Scores Should Not Be Used for Matching.” Political Analysis 27 (4): 435–54. https://doi.org/10.1017/pan.2019.11.
Li, Fan, Kari Lock Morgan, and Alan M. Zaslavsky. 2018. “Balancing Covariates via Propensity Score Weighting.” Journal of the American Statistical Association 113 (521): 390–400. https://doi.org/10.1080/01621459.2016.1260466.
Robins, James M., Andrea Rotnitzky, and Lue Ping Zhao. 1994. “Estimation of Regression Coefficients When Some Regressors Are Not Always Observed.” Journal of the American Statistical Association 89 (427): 846–66. https://doi.org/10.1080/01621459.1994.10476818.
Rosenbaum, Paul R. 2002. Observational Studies. 2nd ed. Springer Series in Statistics. Springer. https://doi.org/10.1007/978-1-4757-3692-2.
Rosenbaum, Paul R., and Donald B. Rubin. 1983. “The Central Role of the Propensity Score in Observational Studies for Causal Effects.” Biometrika 70 (1): 41–55. https://doi.org/10.1093/biomet/70.1.41.
———. 1985. “Constructing a Control Group Using Multivariate Matched Sampling Methods That Incorporate the Propensity Score.” The American Statistician 39 (1): 33–38. https://doi.org/10.1080/00031305.1985.10479383.
Stuart, Elizabeth A. 2010. “Matching Methods for Causal Inference: A Review and a Look Forward.” Statistical Science 25 (1): 1–21. https://doi.org/10.1214/09-STS313.
VanderWeele, Tyler J., and Peng Ding. 2017. “Sensitivity Analysis in Observational Research: Introducing the E-Value.” Annals of Internal Medicine 167 (4): 268–74. https://doi.org/10.7326/M16-2607.
Zubizarreta, José R. 2015. “Stable Weights That Balance Covariates for Estimation with Incomplete Outcome Data.” Journal of the American Statistical Association 110 (511): 910–22. https://doi.org/10.1080/01621459.2015.1023805.
| Thank you for your attention! | |

 |
|
Causal Data Science for Business Analytics | 6. Observed Confounding