5. Online A/B Testing

Causal Data Science for Business Analytics

Christoph Ihl

Hamburg University of Technology

Monday, 18. May 2026

Online A/B Testing at Scale

Online A/B testing is randomization at industrial scale — and most experiments still fail.

Online A/B testing decides product roadmaps — and most experiments fail

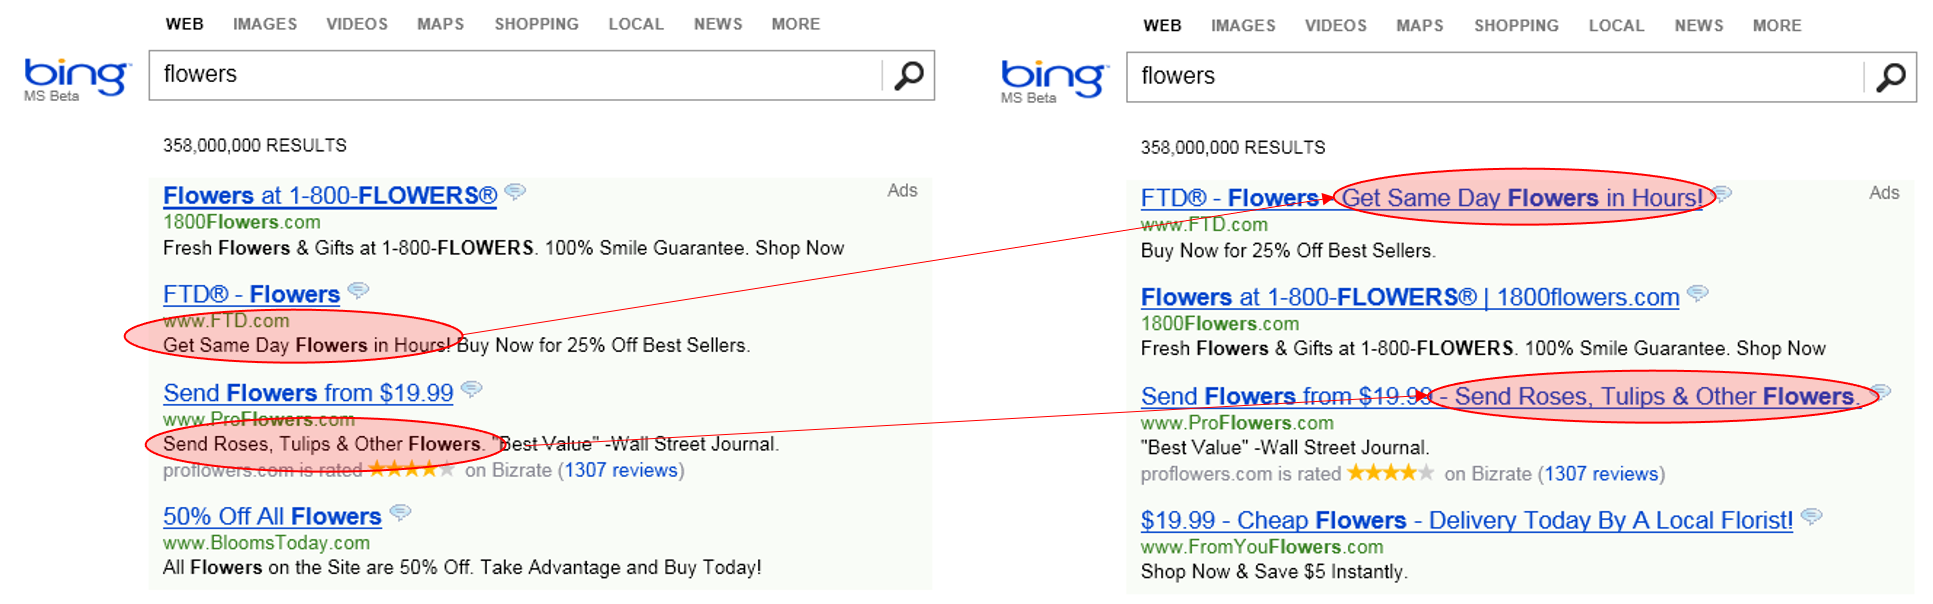
A single Bing experiment in 2012 — moving ad-title text into a single line — drove +$100M/year in revenue at one site (Kohavi, Tang, and Xu 2020).

Across the wider tech industry, roughly 85% of feature experiments fail to ship (Kohavi et al. 2012). The marginal experiment is a small loss — but the marginal successful experiment can dominate an entire quarter’s revenue.

Why this matters for causal inference

A/B testing is the only causal-identification strategy that runs at this scale. Every later session in the course (matching, IV, DiD, synthetic controls) is what you reach for when an A/B test is infeasible or unethical.

From “+55% lift” to ≈0: what a 7-million-user replication found

Biswas, Abell, and Chacko (2024) (JCR 2024) reported that swapping a sharp-cornered CTA button for a curved one lifted conversion by 55% on an e-commerce homepage — published, peer-reviewed, widely cited by CRO consultancies.

Sharp angled (control)
CTR = 7.19% · 32 / 445
Curved (treatment)
CTR = 11.18% · 53 / 474
\(\chi^2 = 4.35\), \(p = 0.037\) · \(n = 919\) visits over 3 weeks

Kohavi et al. (2026) ran three pre-registered replications at SeaWorld and Coop Norway: 2.8M + 2.2M + 1.9M users (each over \(2{,}000{\times}\) the original). Estimated lifts: 0.16% (\(p=0.20\)), 0.29% (\(p=0.60\)), 0.73% (\(p=0.09\)) — two orders of magnitude smaller, all 95% CIs include zero.

What the original study failed to do

No pre-declared MDE. No power calculation. With \(n \approx 16\sigma^2/\delta^2\), a sub-1% true effect needs millions of users — not hundreds. The paper’s companion Study 1 (Google Ads) also had a 44:56 SRM (\(z = 46\)) and lacked random assignment, but the +55% headline came from Study 2, not Study 1. Lesson: any “significant” finding from an underpowered design must overstate the truth — that’s the winner’s curse, not a bug.

A typical online experiment looks different on five dimensions

The Job Corps RCT from Session 4 had n = 9,240 and a binary, well-measured outcome. Production A/B platforms are different (Kohavi et al. 2012):

  • Tiny effect sizes. Most real product effects are 0.1–1% relative lifts — power requires millions of users per arm.
  • Heterogeneous populations. Bots, returning vs. new users, mobile vs. desktop, geo — heterogeneity inflates outcome variance dramatically.
  • Fixed-budget testing. Tens of thousands of simultaneous experiments compete for the same traffic; you can’t extend an experiment to wait for power.
  • Peeking pressure. Product managers want daily updates. Repeated significance checks inflate Type-I error.
  • Carryover across sessions. The same user sees the experiment on multiple visits; primacy and novelty effects bias short-horizon estimates.

Five puzzling outcomes at Bing illustrate the frictions

Five Bing experiments where the correct read contradicted the naive one (Kohavi et al. 2012):

Puzzle 1 — Novelty wearing off

A new feature lifted clicks +2% in week 1 but inverted to −1% by week 4. Users click anything new at first; persistent gains require waiting for that excitement to fade. Short tests systematically overestimate long-run effects.

Puzzle 2 — Click-tracking confound

A click-tracking pixel was added to instrument the treatment but not the control. The pixel itself counted clicks before the page transition fired, inflating the treatment count by 1%. The “lift” was a measurement artefact, not behaviour — treatment and control must share identical instrumentation.

Puzzle 3 — Primacy / learning cost

A UI change decreased engagement on day 1, then exceeded baseline by day 14 as users learned the new layout. Stopping at day 1 ships the wrong decision — killing a winner because the learning cost was misread as a loss. Commit to a minimum test length tuned to the typical learning curve.

Puzzles 4–5 — Power and length

A 5% MDE (minimum detectable effect) on a metric with \(\sigma/\mu = 3\) requires ~5M users per arm (\(n \approx 16\sigma^2/\delta^2\)). Most product effects are much smaller — many “null results” are tests too small to see what’s there. Most Bing tests run ≥ 2 weeks specifically to clear the carryover and primacy windows (Puzzles 1 & 3).

Source: Kohavi, Deng, Frasca, Walker, Xu & Pohlmann (2012), Five Puzzling Outcomes Explained, KDD.

OEC: one Overall Evaluation Criterion is the only way to avoid metric whack-a-mole

Every experiment must commit, before launch, to a single Overall Evaluation Criterion (OEC) — the one number that decides whether the experiment ships (Kohavi, Tang, and Xu 2020).

What an OEC is

  • A scalar metric (or a fixed weighted sum) aligned with long-term business value.
  • Computable from the short-horizon experiment data — typically 1–4 weeks.
  • Pre-specified — chosen at design time, not after looking at results.

What an OEC is NOT

  • Not a dashboard of 50 metrics (“any green = ship”) — this is metric whack-a-mole.
  • Not a quarterly P&L number — too slow.
  • Not a single ML loss function — proxies the model, not the user.

Every OEC sits on three metric families: drivers, guardrails, data-quality

A modern A/B-test dashboard pairs the OEC with two supporting metric families (Kohavi, Tang, and Xu 2020):

Family Purpose Examples
Driver (OEC) The single number the experiment moves to ship. Sessions per user; revenue per visitor; clicks per session.
Guardrail Side effects we must NOT regress. Page-load latency (p95); crash rate; unsubscribe rate.
Data-quality Checks that the experiment is interpretable at all. SRM p-value; missing-data %; bot share; tracking-parity diff.

A typical decision rule: ship if driver up significantly AND no guardrail down AND data-quality clean. Stack 4 of this deck is mostly about the data-quality family.

The same raw event log supports five different aggregation choices

Each identifies different causal estimands with different signal-to-noise properties.

Type Formula Example Comment
Single average \(\bar{Y} = \frac{1}{n}\sum_{i=1}^{n} Y_i\) Mean revenue per user; conversion rate (conversions ÷ visitors). One outlier (“whale”) can dominate; check the tail.
Double average \(\frac{1}{N}\sum_{i=1}^{N}\left(\frac{1}{n_i}\sum_{j=1}^{n_i} x_{ij}\right)\) Per-user CTR averaged across users; mean session-length per user. Equal weight per unit, regardless of activity level.
Weighted average \(\frac{\sum_{i=1}^{N} w_i\, x_i}{\sum_{i=1}^{N} w_i}\) Revenue per visit (visits as weights); revenue-weighted CTR. Choose \(w_i\) aligned with business value; decouples unit of analysis from unit of randomization → cluster-robust SEs.
Percentile \(Q_p(Y) = \inf\{y : F_Y(y) \geq p\}\) p95 page-load latency; p90 time-to-convert. Tail-focused; means hide latency tails. Needs special variance estimators.
Conditional \(\frac{1}{|S|}\sum_{i \in S} x_i\),  \(S \subset \{1,\dots,n\}\) Conversion rate among visitors who reached checkout; revenue per purchaser. Dangerous when \(S\) is post-treatment. Collider bias (S02): sessions where the user actually checked out are a treatment-affected subsample.

OEC at an Internet Search Engine

Revenue is roughly proportional to queries served. Which leg of that revenue identity should the OEC track?

\[ \frac{\text{Queries}}{\text{Month}} \;=\; \frac{\text{Queries}}{\text{User}} \;\times\; \frac{\text{Users}}{\text{Month}} \]

  • Users / Month — market share / acquisition; not movable by a ranking experiment in a 2-week window.
  • Queries / User — the only movable leg; directly proportional to revenue. Good OEC?

Decompose once more to see which part of Queries / User is the trap:

\[ \frac{\text{Queries}}{\text{User}} \;=\; \frac{\text{Queries}}{\text{Session}} \;\times\; \frac{\text{Sessions}}{\text{User}} \]

  • Queries / Session — revenue-direct, but quality-inverted: rises when users re-query after bad results.
  • Sessions / User — useful behavior: rises when users come back because the engine works.

The fix: switch the OEC to Sessions / User — a long-horizon engagement proxy. A user who succeeds on their first query returns more often, even though each session has fewer queries.

Reading hook: Larsen et al. 2024 surveys this whole landscape

Today’s lecture is, in effect, the lecture-length version of one paper:

Larsen, Stallrich, Sengupta, Deng, Kohavi & Stevens (2024). “Statistical Challenges in Online Controlled Experiments.” The American Statistician 78(2): 135–149. (Larsen et al. 2024)

The paper covers — in the same order — OEC design, variance reduction (CUPED), sequential and Bayesian inference, SRM, SUTVA, switchback designs, and surrogate metrics. Required reading for Assignment II.

If you only read one A/B-testing paper this semester, read this one. The Kohavi book (Kohavi, Tang, and Xu 2020) is the practitioner companion.

Stratified A/B Testing and Variance Reduction

Variance is money — every method in this stack converts variance into more experiments per quarter.

Stratified A/B testing = S04 blocking, renamed

In Session 04 we showed that block randomization on a pre-treatment covariate \(S\) enforces exact balance and reduces variance. The estimator was a stratum-weighted average:

\[\hat\tau_{\text{strat}} \;=\; \sum_{k=1}^{K} \pi_k\, \hat\tau_k, \qquad \pi_k = \tfrac{n_k}{n}.\]

Same estimator, different vocabulary

In the tech industry, this is called stratified A/B testing, and the strata \(S_k\) are typically defined as a Cartesian product of two or three production-relevant variables:

  • Microsoft ExP: activity-decile × market × device
  • Netflix XP: country × device × plan × pre-period-minutes
  • Booking ExP: platform × device × country × booker-type

These stratification keys have very high-cardinality (often hundreds to thousands of strata) and are refreshed often daily from production data.

Microsoft, Netflix, Booking, LinkedIn, Uber all stratify

Company / Platform Stratification key Typical strata count
Microsoft ExP Activity-decile × market × device-type ~600
Netflix XP Country × device × plan × pre-period viewing minutes ~10,000
Booking ExP Platform × device × country × booker type ~5,000
LinkedIn XLNT Activity-decile × region × member type ~500
Uber Morpheus City × time-of-day × rider tier ~2,000

Stratifying on activity decile is universal — pre-period engagement is the single most predictive covariate of post-period engagement in almost every product. This is exactly why CUPED generalises stratification to a continuous pre-period covariate.

Sources: Kohavi, Tang, and Xu (2020) ch. 22; published Netflix, Booking, LinkedIn, and Uber engineering blogs (2020–2024).

Controlled-experiment Using Pre-Experiment Data

CUPED (Deng et al. 2013) defines the adjusted outcome:

\[Y^{\text{cuped}}_i \;=\; Y_i \;-\; \theta \,(Y^{\text{pre}}_i - \bar Y^{\text{pre}}).\]

The variance-minimising \(\theta\) is the OLS slope of \(Y\) on \(Y^{\text{pre}}\):

\[\theta^* \;=\; \frac{\operatorname{Cov}(Y, Y^{\text{pre}})}{\operatorname{Var}(Y^{\text{pre}})}.\]

ATE is estimated as the simple mean difference of \(Y^{\text{cuped}}\) across arms.

Variance reduction

With \(\rho = \operatorname{Corr}(Y, Y^{\text{pre}})\), the CUPED estimator’s variance shrinks by exactly the squared correlation:

\[\operatorname{Var}(\hat\tau^{\text{cuped}}) \;=\; (1 - \rho^2)\,\operatorname{Var}(\hat\tau^{\text{naive}}).\]

No-interaction case of Lin (2013) (Lin 2013) with \(X = Y^{\text{pre}}\): under balanced assignment and homogeneous slopes the two coincide; in general they differ by Lin’s treatment-by-covariate interaction term.

CUPED in 6 lines: an explicit Monte-Carlo demonstration

Simulate \(Y_{\text{pre}} \sim \mathcal{N}(0, 1)\), \(Y = Y_{\text{pre}} + \tau D + \varepsilon\) with \(\tau = 0.1\) and \(\rho \approx 0.7\). Compare the naive mean-diff SE to the CUPED SE.

Show code
set.seed(42)
n <- 20000
Y_pre <- rnorm(n)
D     <- rbinom(n, 1, 0.5)
Y     <- Y_pre + 0.1 * D + rnorm(n, sd = 1)            # rho approx 0.7

theta    <- cov(Y, Y_pre) / var(Y_pre)
Y_cuped  <- Y - theta * (Y_pre - mean(Y_pre))

se_naive <- summary(lm(Y       ~ D))$coef["D", "Std. Error"]
se_cuped <- summary(lm(Y_cuped ~ D))$coef["D", "Std. Error"]

c(SE_naive = round(se_naive, 4),
  SE_cuped = round(se_cuped, 4),
  ratio    = round((se_cuped / se_naive)^2, 3))        # ratio approx 1 - rho^2
SE_naive SE_cuped    ratio 
  0.0200   0.0141   0.4970 
Show code
import numpy as np
import statsmodels.api as sm

rng = np.random.default_rng(42)
n = 20000
Y_pre = rng.standard_normal(n)
D     = rng.binomial(1, 0.5, n)
Y     = Y_pre + 0.1 * D + rng.standard_normal(n)        # rho approx 0.7

theta    = np.cov(Y, Y_pre, ddof=1)[0, 1] / np.var(Y_pre, ddof=1)
Y_cuped  = Y - theta * (Y_pre - Y_pre.mean())

se_naive = sm.OLS(Y,       sm.add_constant(D)).fit().bse[1]
se_cuped = sm.OLS(Y_cuped, sm.add_constant(D)).fit().bse[1]

print({"SE_naive": round(se_naive, 4),
       "SE_cuped": round(se_cuped, 4),
       "ratio":    round((se_cuped / se_naive)**2, 3)}) # ratio approx 1 - rho^2
{'SE_naive': np.float64(0.0201), 'SE_cuped': np.float64(0.0141), 'ratio': np.float64(0.493)}

Output: variance ratio ≈ 0.5 — the analytical \((1 - \rho^2) \approx 0.5\) for \(\rho \approx 0.7\).

Microsoft reports 50% variance reduction → 2× experiment throughput

Deng et al. (2013) report on Bing’s deployment:

Production numbers from Microsoft Bing

  • \(\rho(Y, Y^{\text{pre}}) \approx 0.7\) for most engagement metrics — pre-period predicts post-period strongly.
  • Variance reduction: \((1 - 0.7^2) = 0.51\) → 49% smaller variance.
  • Sample-size requirement to detect the same MDE: \(n\) shrinks by ~50%.
  • Wall-clock effect: a 2-week test becomes a 1-week test → 2× experiments per quarter.

Netflix and LinkedIn report similar numbers (\(\rho \approx 0.6\)–\(0.8\) on viewing-minutes and feed-engagement metrics). CUPED is now table-stakes at any tech-company experimentation platform (Kohavi, Tang, and Xu 2020 ch. 22).

CUPAC: Control Using Predictions As Covariates

Instead of using the pre-period outcome directly, train an ML model on all pre-period features to predict \(Y\):

\[\hat Y^{\text{pre}}_i \;=\; \hat f(X^{\text{pre}}_i),\]

where \(\hat f\) is typically an xgboost regressor fit on \((X^{\text{pre}}_i, Y_i)\) in a pre-period holdout.

Use this prediction as the CUPED covariate:

\[Y^{\text{cupac}}_i \;=\; Y_i \;-\; \theta\,(\hat Y^{\text{pre}}_i - \bar{\hat Y}^{\text{pre}}).\]

DoorDash production results

DoorDash reports 40% reduction in test length over CUPED alone — pre-period order frequency, geography, and tenure together predict post-period GMV (gross merchandise value: total dollar value of items ordered, the marketplace’s top-line OEC) better than pre-period GMV alone.

MLRATE: ML-based regression-adjusted treatment effect — NeurIPS 2021

Guo et al. (2021) (Facebook) push CUPAC into a doubly robust + cross-fitted framework:

  1. Fit \(\hat f(X) \approx \mathbb{E}[Y \mid X]\) via gradient-boosted trees, using cross-fitting to avoid overfit.
  2. Construct the residual outcome \(\tilde Y_i = Y_i - \hat f(X_i)\).
  3. Regress \(\tilde Y\) on \(D\) with HC-robust SEs — this is the MLRATE estimator.

Reported gains on 48 Facebook metrics: median 70% variance reduction over the unadjusted mean-difference; 35% reduction over CUPED with a single pre-period covariate.

Preview of Session 8

The cross-fitting + DR framework here is identical to the Double Machine Learning machinery for observational data — same structural form, different identification assumption (randomization vs. unconfoundedness). We will return to this in Session 8.

CUPED design checklist: pre-period length, refresh cadence, freshness

Operational guidance from Kohavi, Tang, and Xu (2020) ch. 22 for deploying CUPED in production:

  • Pre-period length — 1–2 weeks. Shorter is noisier; longer captures stale behaviour and dilutes correlation with the post-period.

  • Theta refresh cadence — fix \(\theta\) at experiment start, not per-day. Re-estimating \(\theta\) each day inflates Type-I error (it implicitly uses post-randomization data).

  • Covariate freshness — pre-period must end before randomization. Any overlap means the covariate is post-treatment for some users.

  • New users — users without pre-period data get \(Y^{\text{pre}} = \bar Y^{\text{pre}}\) imputed; CUPED contributes nothing for them.

  • Pitfall — never use a pre-period covariate computed after a user was admitted to the experiment. That is the classic SRM-or-bias path.

Takeaway: variance reduction = experiments per quarter

Every method in this stack converts residual variance into experimental throughput:

Method Typical variance cut Wall-clock effect
Stratified A/B 20–40% 20–40% fewer users for same MDE
CUPED ~50% 2× experiments per quarter
CUPAC / MLRATE 60–70% 3× experiments per quarter

Throughput is the metric. Variance reduction is the lever.

Three Modes of A/B Inference

Three answers to one question: when can I stop?

Fixed-horizon frequentist · Sequential testing · Bayesian

Fixed-horizon frequentist: pick \(n\), run, test once, decide

The textbook mode from Session 4. Procedure:

  1. Pre-commit to a sample size \(n\) based on a target MDE and power calculation.
  2. Run the experiment to \(n\) users; collect \((Y_i, D_i)\).
  3. Compute the two-sample \(t\)-statistic on the OEC:

\[t \;=\; \frac{\hat\tau}{\widehat{se}(\hat\tau)} \;=\; \frac{\bar Y_1 - \bar Y_0}{\sqrt{s_1^2/n_1 + s_0^2/n_0}}.\]

  1. Reject \(H_0: \tau = 0\) if \(|t| > 1.96\) (two-sided, \(\alpha = 0.05\)). Ship if rejected and \(\hat\tau > 0\).

Validity rests on testing exactly once. Every additional peek at the t-statistic inflates the Type-I error — this is the pathology that motivates other inference methods.

Minimum Detectable Effect: how many users do you need to spot a 1% lift?

For a two-sample \(t\)-test at significance \(\alpha\) and power \(1-\beta\), the Minimum Detectable Effect \(\delta\) requires:

\[n \;\approx\; \frac{2(z_{\alpha/2} + z_{\beta})^2 \, \sigma^2}{\delta^2}.\]

Worked example: detect a 1% relative lift on an engagement metric with \(\sigma / \mu = 2\).

Show code
# detect a 1% relative lift on a metric with sigma/mu = 2
mu     <- 1
sigma  <- 2 * mu
delta  <- 0.01 * mu                          # absolute MDE
# n approx 2 (z_{alpha/2} + z_{beta})^2 sigma^2 / delta^2
z_a <- qnorm(1 - 0.05/2)
z_b <- qnorm(0.80)
n_per_arm <- 2 * (z_a + z_b)^2 * sigma^2 / delta^2
ceiling(n_per_arm)
[1] 627911
Show code
from statsmodels.stats.power import TTestIndPower
mu, sigma = 1, 2 * 1
delta = 0.01 * mu
d_eff = delta / sigma
n = TTestIndPower().solve_power(
    effect_size=d_eff, alpha=0.05, power=0.80, alternative="two-sided")
print(round(n))
627910

Output: \(n \approx 627{,}000\) users per arm → ~1.25M users total → trivially fast at Bing’s traffic, but out of reach for any startup without traffic in the millions — the variance-reduction methods are how platforms compress this.

Permutation p-values: Fisher’s exact test, returned from S04

In Session 4 we promised: Fisher’s permutation logic returns next session as the engine behind A/B-test p-values. Here it is.

Under Fisher’s sharp null \(H_0: Y_i(1) = Y_i(0)\) for every \(i\), the observed outcomes are fixed; only the treatment-assignment vector \(\mathbf{D}\) is random. The exact \(p\)-value is

\[p \;=\; \frac{1}{|\mathcal{P}|} \sum_{\pi \in \mathcal{P}} \mathbf{1}\{|\hat\tau_\pi| \geq |\hat\tau_{\text{obs}}|\},\]

computed by enumerating (or Monte-Carlo sampling) re-shuffles \(\pi\) of the assignment labels.

Where you’ve seen this in production

When Optimizely, VWO, or Eppo report “exact p-value” or “permutation p-value”, this is the algorithm. They use ~10,000 random permutations rather than enumerating all \(\binom{n}{n_1}\), which is computationally infeasible.

The trade-off vs. the asymptotic \(t\)-test: Fisher is exact in finite samples (no CLT approximation), at the cost of compute. For \(n < 200\) or heavy-tailed outcomes, Fisher is the safer choice.

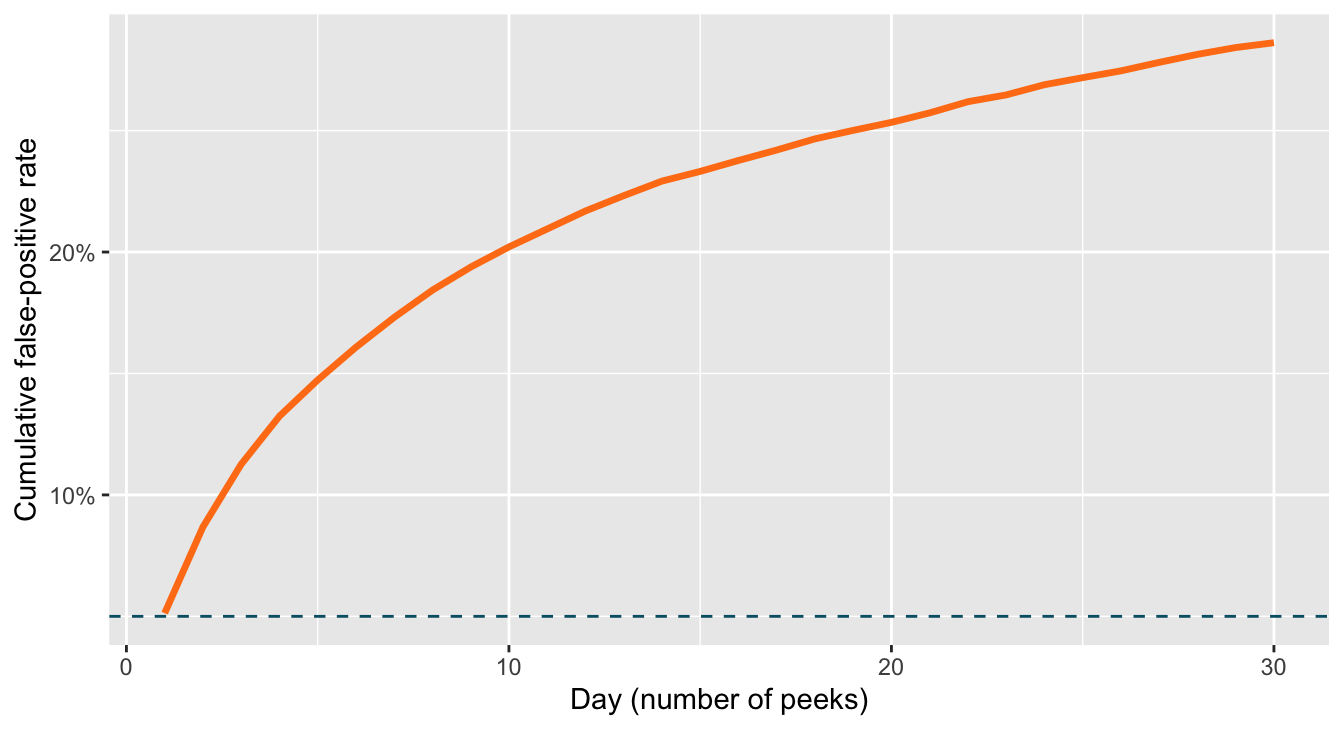
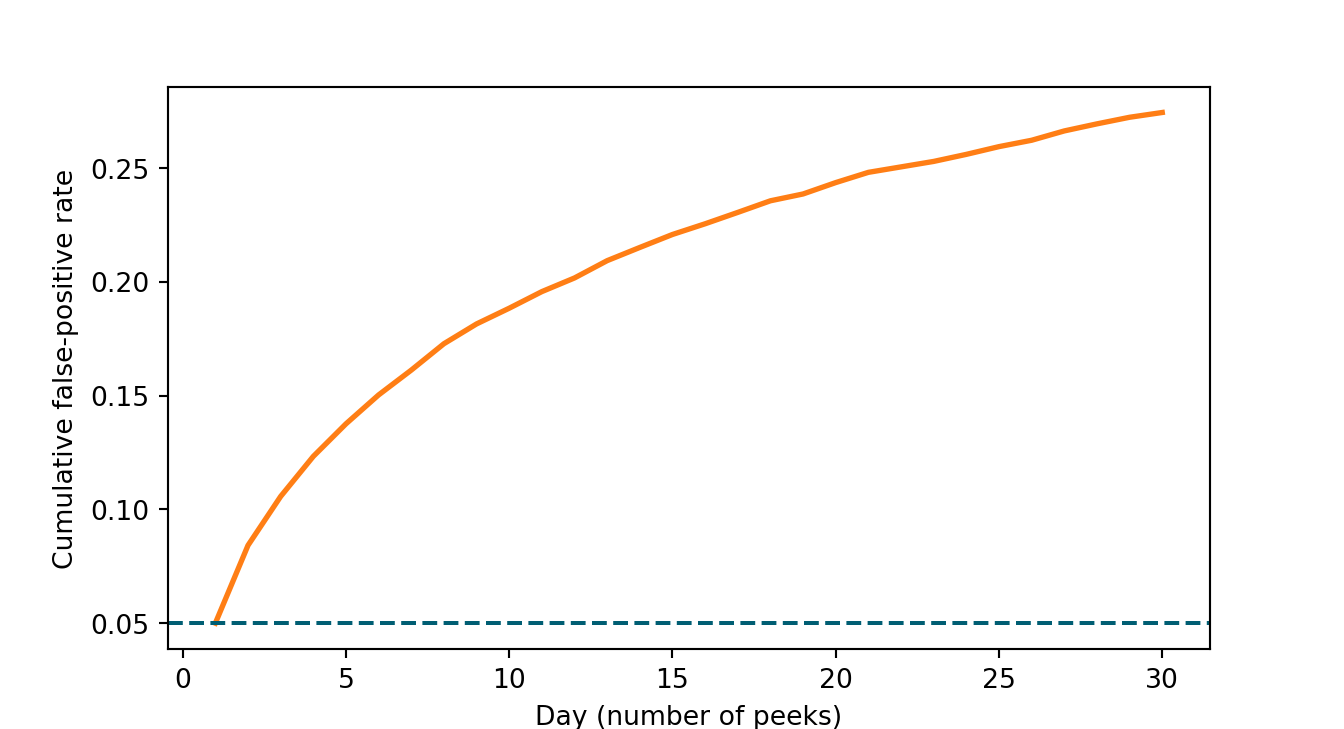
Peeking inflates Type-I error: simulated 5% test runs at 30% false-positive rate

A fixed-horizon test controls Type-I error at the planned endpoint. If you check daily and stop at the first significance, you are running 30 simultaneous tests, each with \(\alpha = 5\%\).

Show simulation
set.seed(7)
n_sims  <- 10000
n_days  <- 30
n_per_day <- 200

# Under H0 (no effect), simulate per-day t-tests and count when any peek rejects.
any_reject <- function() {
  YA <- rnorm(n_days * n_per_day)
  YB <- rnorm(n_days * n_per_day)            # no treatment effect
  for (d in seq_len(n_days)) {
    idx <- 1:(d * n_per_day)
    p   <- t.test(YA[idx], YB[idx])$p.value
    if (p < 0.05) return(d)                  # first day that rejects
  }
  return(NA_integer_)
}
first_reject <- replicate(n_sims, any_reject())

# Cumulative Type-I error vs number of peeks
day  <- 1:n_days
ti_d <- sapply(day, function(d) mean(!is.na(first_reject) & first_reject <= d))

library(ggplot2)
ggplot(data.frame(day = day, ti = ti_d), aes(day, ti)) +
  geom_line(colour = "#FF7E15", linewidth = 1.2) +
  geom_hline(yintercept = 0.05, linetype = "dashed", colour = "#005e73") +
  scale_y_continuous(labels = scales::percent_format(1)) +
  labs(x = "Day (number of peeks)", y = "Cumulative false-positive rate")

Show simulation
import numpy as np
from scipy import stats
import matplotlib.pyplot as plt

rng = np.random.default_rng(7)
n_sims, n_days, n_per_day = 10000, 30, 200

first_reject = np.full(n_sims, -1, dtype=int)
for s in range(n_sims):
    YA = rng.standard_normal(n_days * n_per_day)
    YB = rng.standard_normal(n_days * n_per_day)
    for d in range(1, n_days + 1):
        idx = slice(0, d * n_per_day)
        p = stats.ttest_ind(YA[idx], YB[idx]).pvalue
        if p < 0.05:
            first_reject[s] = d
            break

day = np.arange(1, n_days + 1)
ti  = np.array([np.mean((first_reject != -1) & (first_reject <= d)) for d in day])

plt.figure(figsize=(7, 3.8))
plt.plot(day, ti, color="#FF7E15", linewidth=2)
plt.axhline(0.05, linestyle="--", color="#005e73")
plt.xlabel("Day (number of peeks)")
plt.ylabel("Cumulative false-positive rate")
plt.show()

Result: ~30% false-positive rate after 30 daily peeks — six times the nominal \(\alpha = 5\%\).

Empirical evidence: 28–37% of significant A/B tests at marketplaces are false discoveries

Berman and Van den Bulte (2022) analyse 4,964 experiments at a major marketplace platform and back out the false-discovery rate using a hierarchical model of effect-size distributions.

The headline

Among experiments declared significant at \(\alpha = 0.05\):

  • 28–37% are estimated to be false discoveries — the null is actually true.
  • Peeking and multiple-testing without adjustment are the two main drivers.
  • Smaller-traffic experiments (where teams peek more aggressively to compensate) have the highest FDR.

These numbers are not from the previous-slide simulation; they are empirical estimates from a real production A/B-testing log. The cure is one of the three modes in this stack — or all three.

Three cures: alpha-spending, sequential testing, Bayesian

Each cure changes the inferential object to make peeking honest.

1. Alpha-spending (Pocock / O’Brien-Fleming)

Pre-budget the total Type-I error across \(K\) planned interim looks. Each look uses a smaller \(\alpha_k\) so the family-wise rate stays at the nominal level. Used in clinical trials since the 1970s; rare in tech.

2. Sequential / anytime-valid testing

Construct a confidence sequence — a CI valid simultaneously at every \(n\), not just at a single planned endpoint. Peek as often as you like; the CI’s coverage guarantee is unchanged.

3. Bayesian decision rule

Replace the p-value with the posterior probability that B beats A. Posterior probability is coherent under any stopping rule — there is no “peeking penalty” to begin with.

Sequential testing: confidence sequence valid at every \(n\) simultaneously

A confidence sequence \(\{CI_n\}_{n \geq 1}\) for parameter \(\theta\) is a sequence of intervals such that

\[\mathbb{P}\big(\theta \in CI_n \text{ for all } n \geq 1\big) \;\geq\; 1 - \alpha.\]

Contrast with the fixed-horizon CI, which guarantees \(\mathbb{P}(\theta \in CI_n) \geq 1 - \alpha\) for a single, pre-specified \(n\). Sequential CIs are valid for every \(n\) jointly.

The operational payoff

You can peek as often as you want. Stop the experiment the moment \(CI_n\) excludes 0 — the false-positive rate is still \(\alpha\), no peeking penalty.

Howard et al. (2021) is the canonical reference — Annals of Statistics paper that unified the theory of mixture-method and martingale-based CSs.

Betting confidence sequences: bet against the null, your wealth bounds the \(p\)-value

Waudby-Smith and Ramdas (2024) (JRSS-B) derive martingale-based CSs by treating inference as a betting game:

  1. At each step, place a bet \(\lambda_n\) on the next observation’s deviation from the null mean.
  2. Your wealth process \(W_n\) is a non-negative martingale under \(H_0\) — by Ville’s inequality (the martingale analog of Markov: any non-negative martingale exceeds \(1/\alpha\) with probability at most \(\alpha\)), \(\mathbb{P}(\sup_n W_n \geq 1/\alpha) \leq \alpha\).
  3. Invert: the CS is the set of candidate parameter values that the data has not yet refuted (i.e., whose wealth process is still below \(1/\alpha\)).

The betting framework gives CSs that are tighter than mixture-method CSs (Howard et al. 2021), especially for bounded random variables — typically 20–40% narrower at the same \(\alpha\).

In production: vendors implement betting CSs with confseq (R) and betting-cs (Python). The math is non-trivial but the API is one line.

Eppo as the default-on vendor: sequential is now the industry default

By 2026, sequential testing is opt-out, not opt-in, at the major A/B-testing vendors:

Vendor Default mode (2026) Underlying method
Eppo Sequential Betting CS (Waudby-Smith)
Statsig Sequential Mixture / Howard 2021 CS
Optimizely Sequential “Stats Engine” — mixture-based CS
Microsoft ExP Fixed-horizon (with planned looks) Alpha-spending (legacy)

The reversal is recent: as recently as 2020, fixed-horizon was the default; vendors offered sequential as an “advanced” option. The Berman & Van den Bulte 2022 evidence (slide 23) drove the shift.

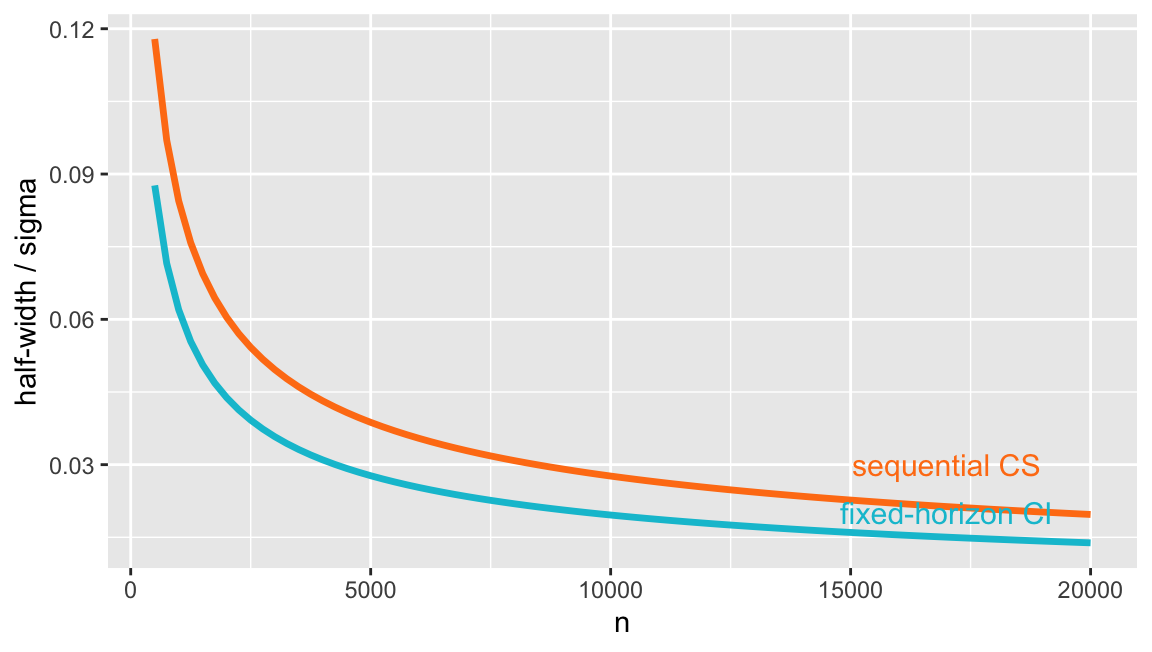
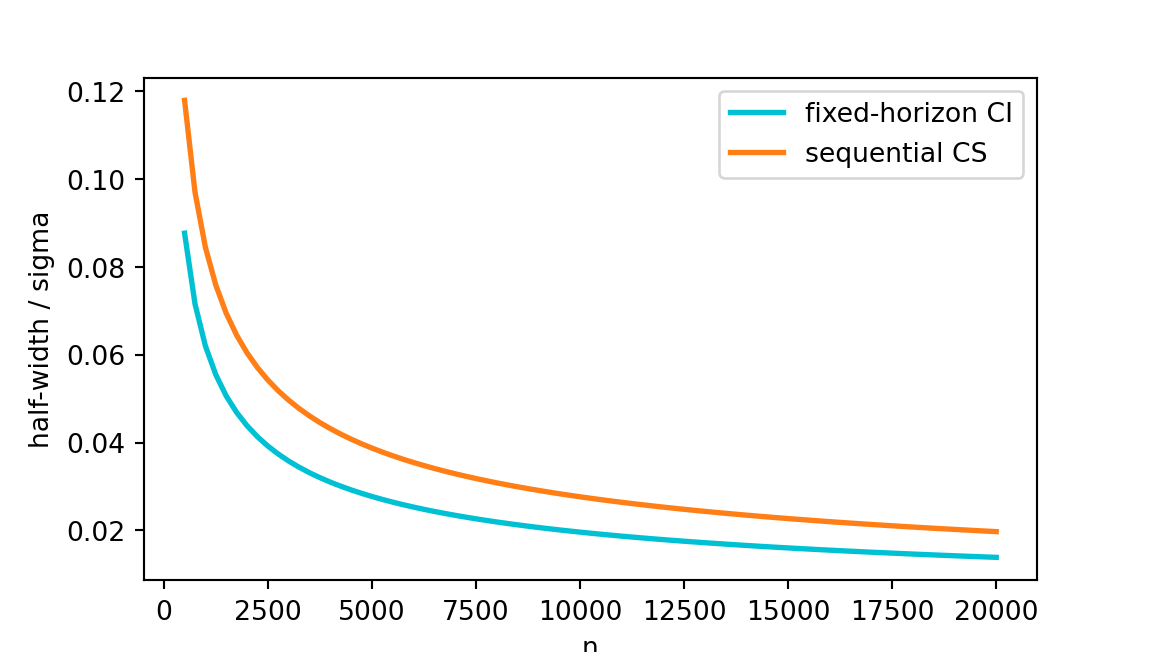
Cost of always-valid: ~15–25% wider intervals than fixed-horizon at the planned \(n\)

Sequential CSs are not free. At the planned sample size \(n^*\), a CS is typically 15–25% wider than the fixed-horizon CI:

Show illustration
# Schematic: fixed CI width is z * sigma/sqrt(n); a generic mixture CS
# scales as ~ sqrt(log(log(n)) / n), so the ratio grows slowly with n.
n  <- seq(500, 20000, by = 250)
ci_fixed <- 1.96 / sqrt(n)
ci_seq   <- sqrt(2 * log(log(n) + 1) + log(1/0.05)) / sqrt(n)

library(ggplot2)
df <- data.frame(n = n, fixed = ci_fixed, seq = ci_seq)
ggplot(df, aes(n)) +
  geom_line(aes(y = fixed), colour = "#00C1D4", linewidth = 1.2) +
  geom_line(aes(y = seq),   colour = "#FF7E15", linewidth = 1.2) +
  annotate("text", x = 17000, y = 0.020, label = "fixed-horizon CI",
           colour = "#00C1D4", size = 4) +
  annotate("text", x = 17000, y = 0.030, label = "sequential CS",
           colour = "#FF7E15", size = 4) +
  labs(x = "n", y = "half-width / sigma")

Show illustration
import numpy as np
import matplotlib.pyplot as plt

n  = np.arange(500, 20001, 250)
ci_fixed = 1.96 / np.sqrt(n)
ci_seq   = np.sqrt(2 * np.log(np.log(n) + 1) + np.log(1/0.05)) / np.sqrt(n)

plt.figure(figsize=(6, 3.4))
plt.plot(n, ci_fixed, color="#00C1D4", linewidth=2, label="fixed-horizon CI")
plt.plot(n, ci_seq,   color="#FF7E15", linewidth=2, label="sequential CS")
plt.xlabel("n"); plt.ylabel("half-width / sigma"); plt.legend()
plt.show()

The honest trade-off: peeking-freedom is paid for in CI width. If you genuinely run a one-shot experiment with no monitoring, fixed-horizon is tighter.

Netflix Sequential blog: CUPED + anytime-valid in production

Lindon et al. (2024) (Netflix) unify the two threads of this deck — variance reduction (Stack 2) and anytime-valid inference (this stack) — into a single production estimator.

  • Apply CUPED to construct \(Y^{\text{cuped}}\) with reduced variance.
  • Construct a betting confidence sequence on \(\mathbb{E}[Y^{\text{cuped}}_1 - Y^{\text{cuped}}_0]\).
  • Report a CS that is both variance-reduced and peeking-safe.

Netflix’s published “Sequential Testing at Netflix” blog series (Pt. 1 & 2, 2024) walks through the implementation, including handling of the CUPED-induced bias correction in the martingale construction.

Why this matters

Variance reduction and sequential testing compound multiplicatively. CUPED halves variance; sequential testing eliminates the peeking penalty. Together they reduce time-to-decision by ~4× vs. naive fixed-horizon analysis.

Bayes’ rule turns wrong readings right

\[\underbrace{P(H \mid \text{data})}_{\text{posterior}} \;\;\propto\;\; \underbrace{P(\text{data} \mid H)}_{\text{likelihood}} \cdot \underbrace{P(H)}_{\text{prior}}\]

Each row below is a different \(P(H \mid \text{data})\) Bayes’ rule lets you compute once you choose a prior on \(H\) and a likelihood for the data.

The intuitive (wrong) reading What frequentist inference actually says The Bayesian reading you wanted
“\(p = 0.03\) means there’s a 3% chance the null is true.” \(p\) = \(P(\text{data} \mid H_0)\), not \(P(H_0 \mid \text{data})\). Compute \(P(H_0 \mid \text{data})\) directly via Bayes’ rule with a prior on \(H_0\).
“There’s a 95% chance \(\tau\) lies in this CI.” CI is a statement about the procedure; a single realised interval either covers or doesn’t. \(P(\tau \in [L, U] \mid \text{data}) = 0.95\) — the credible interval delivers this exact statement.
“\(\alpha = 0.05\) is the probability I’m wrong.” \(\alpha\) = long-run Type-I rate of the procedure. \(P(\tau_B > \tau_A \mid \text{data})\) = posterior “probability of being best” — directly answers the decision question.
“Non-significant means no effect.” Only means “no detectable effect at this \(n, \alpha\)”. Posterior with mass concentrated on \(|\tau| < \varepsilon\) delivers a direct statement of practical equivalence.

The four “wrong” readings on the left are the right readings in a Bayesian framework. The next three slides operationalize this.

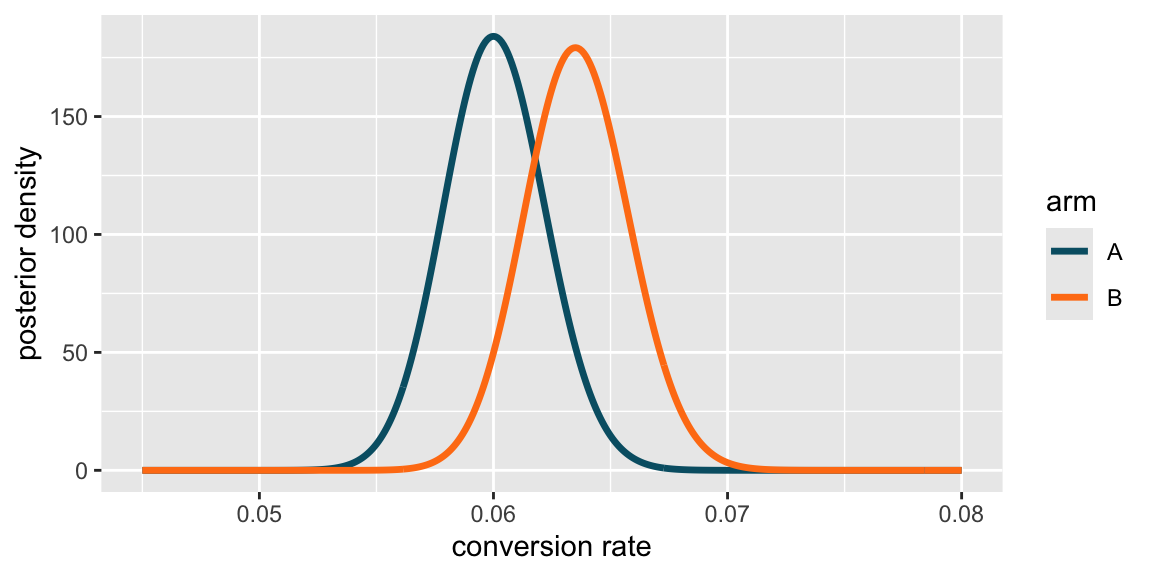
Beta-Binomial conjugate prior: closed-form posterior for conversion rates

For a conversion-rate metric (binary \(Y\)), put a Beta prior on the per-arm rate:

\[\theta_A \sim \text{Beta}(\alpha_A, \beta_A),\]

\[\theta_B \sim \text{Beta}(\alpha_B, \beta_B).\]

Observing \(s_A\) successes from \(n_A\) trials gives the closed-form posterior:

\[\theta_A \mid \text{data} \;\sim\; \text{Beta}(\alpha_A + s_A,\; \beta_A + n_A - s_A).\]

where \(s_A\) = observed conversions in arm A, \(n_A\) = users in arm A (likewise for B).

Show code
# Beta(1,1) = uniform prior on (0,1)
nA <- 12000; sA <- 720
nB <- 12000; sB <- 762
grid <- seq(0.045, 0.080, length.out = 400)

library(ggplot2)
df <- rbind(
  data.frame(theta = grid, arm = "A", dens = dbeta(grid, 1 + sA, 1 + nA - sA)),
  data.frame(theta = grid, arm = "B", dens = dbeta(grid, 1 + sB, 1 + nB - sB)))
ggplot(df, aes(theta, dens, colour = arm)) +
  geom_line(linewidth = 1.2) +
  scale_colour_manual(values = c(A = "#005e73", B = "#FF7E15")) +
  labs(x = "conversion rate", y = "posterior density")

Show code
import numpy as np
from scipy.stats import beta
import matplotlib.pyplot as plt

nA, sA = 12000, 720
nB, sB = 12000, 762
grid = np.linspace(0.045, 0.080, 400)

plt.figure(figsize=(6, 3))
plt.plot(grid, beta.pdf(grid, 1 + sA, 1 + nA - sA), color="#005e73", lw=2, label="A")
plt.plot(grid, beta.pdf(grid, 1 + sB, 1 + nB - sB), color="#FF7E15", lw=2, label="B")
plt.xlabel("conversion rate"); plt.ylabel("posterior density"); plt.legend()
plt.show()

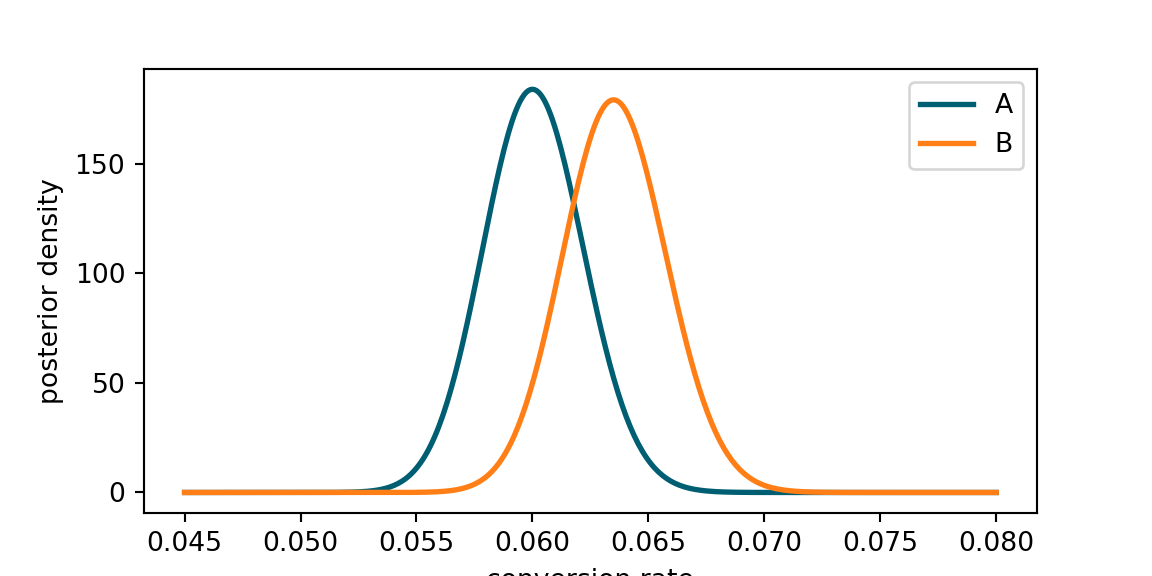
The Beta(1,1) prior is uniform on (0,1) — maximally non-informative. The posteriors are sharp because \(n \approx 12{,}000\) per arm.

Credible interval: 95% probability that \(\theta_A - \theta_B \in [L, U]\)

The credible interval is the Bayesian object that delivers the “95% chance the parameter is in here” statement.

Show code
set.seed(1)
nA <- 12000; sA <- 720
nB <- 12000; sB <- 762
M  <- 100000

# Posterior draws under Beta(1,1) prior
theta_A <- rbeta(M, 1 + sA, 1 + nA - sA)
theta_B <- rbeta(M, 1 + sB, 1 + nB - sB)

# Posterior probability that B beats A
mean(theta_B > theta_A)
[1] 0.86842
Show code
# 95% credible interval for the difference theta_B - theta_A
quantile(theta_B - theta_A, c(0.025, 0.975))
        2.5%        97.5% 
-0.002600881  0.009558765 
Show code
import numpy as np
from scipy.stats import beta

rng = np.random.default_rng(1)
nA, sA = 12000, 720
nB, sB = 12000, 762
M = 100000

theta_A = beta.rvs(1 + sA, 1 + nA - sA, size=M, random_state=rng)
theta_B = beta.rvs(1 + sB, 1 + nB - sB, size=M, random_state=rng)

# P(theta_B > theta_A) and 95% credible interval for difference
print({"P(B>A)": (theta_B > theta_A).mean(),
       "CI95":   np.quantile(theta_B - theta_A, [0.025, 0.975])})
{'P(B>A)': np.float64(0.87167), 'CI95': array([-0.00255895,  0.00958759])}

Output: \(P(\theta_B > \theta_A \mid \text{data}) \approx 0.85\); 95% credible interval ≈ \([-0.0014,\, 0.0084]\). Directly interpretable as “there’s an 85% chance B is better than A.”

Expected-loss decision rule: ship if \(\mathbb{E}[\text{loss}] < \varepsilon\)

Posterior probability “B beats A” answers a comparison; expected loss answers the decision.

The expected loss of shipping B is the posterior expectation of the regret if B turns out worse than A:

\[\mathbb{E}\big[\text{loss}(\text{ship } B)\big] \;=\; \mathbb{E}\big[\max(\theta_A - \theta_B,\, 0) \mid \text{data}\big].\]

Show code
# Expected loss of shipping B (continued from previous slide)
set.seed(2026)
nA <- 12000; sA <- 720
nB <- 12000; sB <- 762
M  <- 100000
theta_A <- rbeta(M, 1 + sA, 1 + nA - sA)
theta_B <- rbeta(M, 1 + sB, 1 + nB - sB)

# Posterior expected loss = E[max(theta_A - theta_B, 0)]
loss_B <- mean(pmax(theta_A - theta_B, 0))
loss_B   # ~ 2.06e-04 with this seed
[1] 0.0002060839

Industry default: ship if \(\mathbb{E}[\text{loss}] < \varepsilon\) where \(\varepsilon\) is calibrated to the metric scale (here \(\varepsilon = 10^{-4}\) for conversion rates ~6%; relative-lift metrics use \(\varepsilon \approx 0.005\) of the baseline). Eppo and Statsig use this construction by default.

\(\varepsilon\) = the “I don’t care below this” regret threshold, in the metric’s own units — set by the business, not by statistics.

In our example: \(\text{loss}_B \approx 2.06 \times 10^{-4} \;>\; \varepsilon = 10^{-4}\) → do not ship B yet, even though \(P(B > A) \approx 0.85\).

Why expected loss, not just \(P(B > A)\)

\(P(B > A) = 0.85\) sounds confident, but the 15% chance B is worse averages a ~0.14 pp gap when it happens — and \(0.15 \times 0.00137 \approx 2.06 \times 10^{-4}\) exceeds \(\varepsilon\). High posterior probability of being best is not the same as low expected regret. Expected loss combines probability and magnitude.

Each inference mode answers a different question — pick by decision context

  Fixed-horizon \(p\)-value Confidence sequence Credible interval
Interpretation \(P(\text{data} \mid H_0)\) — long-run frequency, single test \(P(\theta \in CI_n \forall n) \geq 1-\alpha\) — long-run, all \(n\) \(P(\theta \in [L, U] \mid \text{data}) = 0.95\) — direct probability
Sample-size rule Pre-commit to \(n\) from MDE No pre-commitment; stop when \(CI\) excludes 0 No pre-commitment; stop when posterior decisive
When-to-stop rule Exactly once, at planned \(n\) Any time CS excludes 0 Any time \(\mathbb{E}[\text{loss}] < \varepsilon\)
Peeking-safe? No — 30% FPR at 30 peeks Yes — by construction Yes — posterior coherent under any stopping rule
Width at planned \(n\) Tightest (baseline) 15–25% wider ≈ fixed-horizon (with flat prior)
Production vendors Microsoft ExP, academic RCTs Eppo, Statsig, Optimizely, Netflix Stucchio-style tools, VWO Bayesian, AB Tasty

Choose by decision context: one-shot launch, continuous monitoring, posterior-driven

A decision tree for picking the inference mode:

Is the decision pre-committed and one-shot (e.g., regulatory submission, single launch gate)? → Fixed-horizon. Tightest CIs at the planned \(n\); you don’t need anytime-validity.

Will the experiment be monitored continuously and might be stopped early? → Sequential / confidence sequence. The peeking-safe property is the operational gain.

Is the decision multi-armed AND asymmetric in cost (e.g., choosing among 5 ranking algorithms with very different downside risks)? → Bayesian + expected loss. Posterior over \(\theta_1, \ldots, \theta_5\) + per-arm loss combine cleanly.

Default in 2026 tech: Sequential is the safe choice 80% of the time. Bayesian is gaining ground in conversion-rate testing. Fixed-horizon survives in regulated industries.

When A/B Testing Breaks

The estimator is fine. The assignment and the spillovers are not.

Twyman’s law: any number that looks interesting is usually wrong

Twyman’s law (Kohavi, Tang, and Xu 2020 ch. 21): any statistic that appears interesting is usually a measurement error.

The diagnostic mindset

Every “+200% conversion lift” or “−15% session-length drop” should trigger a data-quality check before a celebration email — not after.

Most “impossibly large” A/B-test effects are:

  1. SRMs in the assignment pipeline
  2. Tracking-parity bugs between treatment and control
  3. Bot traffic disproportionately landing in one arm
  4. Sample-selection effects from upstream filtering

Kohavi et al. (2026) document a Wikimedia donation-button A/B test that reported an implausibly large \(-15\%\) effect — diagnosed as an SRM where the treatment fraction fluctuated between 50% and 100% over the test. Without the SRM check, that \(-15\%\) would have driven a permanent rollback.

Sample Ratio Mismatch: 6% of Microsoft tests, 10% of LinkedIn zoomed-in tests

Sample Ratio Mismatch (SRM): the observed treatment/control allocation ratio significantly deviates from the intended ratio.

Empirical rates (Fabijan et al. 2019):

  • Microsoft Bing: ~6% of all A/B tests show SRM at \(p < 0.001\).
  • LinkedIn: ~10% of zoomed-in (high-traffic, high-stakes) tests show SRM.
  • Most common causes: bot filtering applied unevenly across arms; late-binding assignment in client redirects; deduplication logic stripping the wrong cookie.

The rule of thumb

SRM at \(p < 0.001\) → STOP. Do NOT interpret the experiment. Debug the pipeline first.

SRM is also the single most common false-positive generator — even a 0.3% SRM can drive a “5% lift” purely from selection.

One chi-squared call catches most SRMs before the experiment ships

A one-line diagnostic — the only A/B-test computation that has zero discretionary parameters.

Show code
# Three scenarios: clean, buggy, borderline
scenarios <- list(
  clean      = c(5990, 6010),
  buggy      = c(5640, 6360),
  borderline = c(5910, 6090)
)

results <- sapply(scenarios, function(counts) {
  res <- chisq.test(counts, p = c(0.5, 0.5))
  c(n_A = counts[1], n_B = counts[2],
    chi2 = round(res$statistic, 2),
    p    = signif(res$p.value, 3))
})
t(results)
            n_A  n_B chi2.X-squared        p
clean      5990 6010           0.03 8.55e-01
buggy      5640 6360          43.20 4.94e-11
borderline 5910 6090           2.70 1.00e-01
Show code
import numpy as np
from scipy.stats import chisquare

scenarios = {
    "clean":      (5990, 6010),
    "buggy":      (5640, 6360),
    "borderline": (5910, 6090),
}
expected = lambda counts: [sum(counts) / 2] * 2
for name, counts in scenarios.items():
    chi2, p = chisquare(counts, f_exp=expected(counts))
    print(f"{name:>10}: n_A={counts[0]}, n_B={counts[1]}, "
          f"chi2={chi2:.2f}, p={p:.3g}")
     clean: n_A=5990, n_B=6010, chi2=0.03, p=0.855
     buggy: n_A=5640, n_B=6360, chi2=43.20, p=4.94e-11
borderline: n_A=5910, n_B=6090, chi2=2.70, p=0.1

The buggy scenario rejects at \(p < 0.001\) → stop and debug. The clean scenario passes cleanly (\(p \approx 0.86\)) → proceed. The borderline scenario (\(p \approx 0.10\)) → stratify by device/time first; if one cell is the source, treat as buggy.

SUTVA violation in marketplaces: treating buyers spills to untreated sellers

SUTVA (Stable Unit Treatment Value Assumption) says unit \(i\)’s outcome depends only on unit \(i\)’s treatment — \(Y_i = Y_i(D_i)\), not \(Y_i(D_1, \ldots, D_n)\).

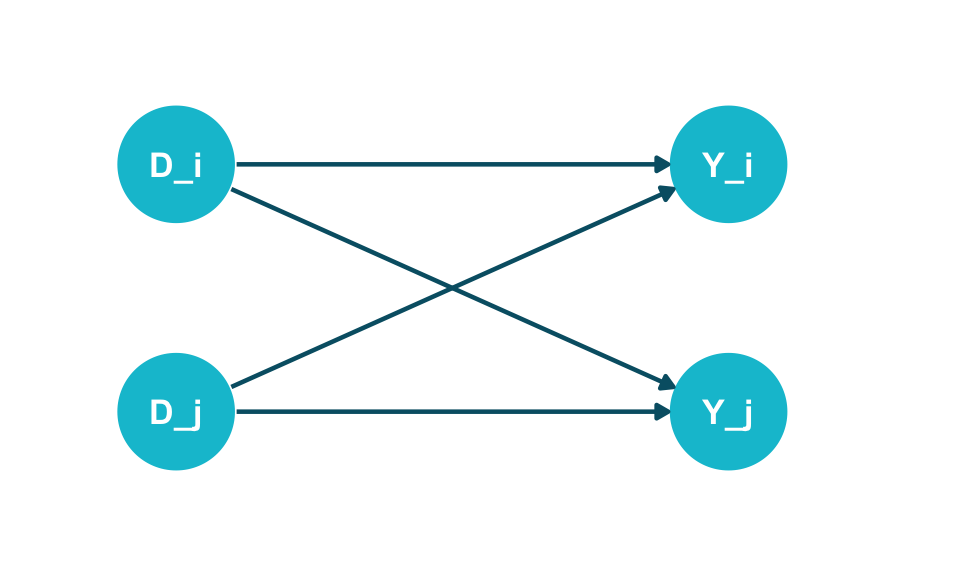
Two-sided market: treating buyer \(i\) affects seller \(j\)’s response, which affects buyer \(j\)’s outcome.

Concrete examples:

  • Ride-share: surge pricing for treated riders displaces untreated riders’ wait times.
  • Marketplace: new search ranking shifts shared supply between treated and untreated buyers.
  • Social network: a feed change reaches untreated users via friend activity.

\(Y_i\) depends on \(D_j\) (\(j \neq i\)) — SUTVA fails.

User-level randomization estimates an effect diluted by spillover — toward zero in most marketplaces, away from zero in some. The next slide gives empirical evidence at Airbnb.

Airbnb meta-experiment: cluster-randomization reduces SUTVA bias

Holtz et al. (2024) ran a meta-experiment at Airbnb: same intervention, randomized at two scales simultaneously.

  • User-level randomization: each user independently treated or control.
  • Cluster (market-level) randomization: entire geographic markets treated or control; spillovers contained within a market.

The empirical finding

The cluster-randomized estimate was ~32% larger than the user-level estimate.

Interpretation: user-level randomization underestimated the true global treatment effect by ~32% because untreated users absorbed some of the treatment’s positive externality.

The fix: when the unit of analysis is a marketplace, randomize at the marketplace level (geography, store, region) — not at the user level.

Switchback designs: alternate global treatment across short time windows

When spillover is temporal (e.g., a dispatch algorithm changes the system-wide supply state for the next 30 minutes), splitting units doesn’t work — split time instead.

Switchback design (Bojinov, Simchi-Levi, and Zhao 2023): divide time into windows of length \(w\); in each window, set \(D = 1\) globally or \(D = 0\) globally; randomize the alternation.

Pros: handles cross-unit interference by treating the whole system; estimator is a simple windowed difference. Cons: temporal autocorrelation inflates the variance; carryover at window boundaries biases the estimate.

DoorDash uses 30-minute switchback windows for 30% faster iteration

DoorDash production deployment (Bojinov, Simchi-Levi, and Zhao 2023):

  • Application: dispatch-algorithm A/B tests. Dispatch is a system-wide policy — assigning Dasher to order is interference-by-design.
  • Window length: 30 minutes — long enough for the dispatch decision’s downstream effect to dissipate; short enough to log enough switches per day.
  • Carryover correction: drop the first 5 minutes after each switch (the “warm-up” zone where the system is still equilibrating).

The throughput gain

Switchback designs let DoorDash run dispatch-algorithm experiments in 3–7 days versus the 2–3 weeks required by cluster (market-level) randomization — a 30% iteration-speed gain in their published 2023 case study.

Switchback has spread to Lyft (matching algorithms), Uber (surge pricing), and several food-delivery platforms. The reference design for any system-level policy test.

Carryover decay rates determine optimal window length

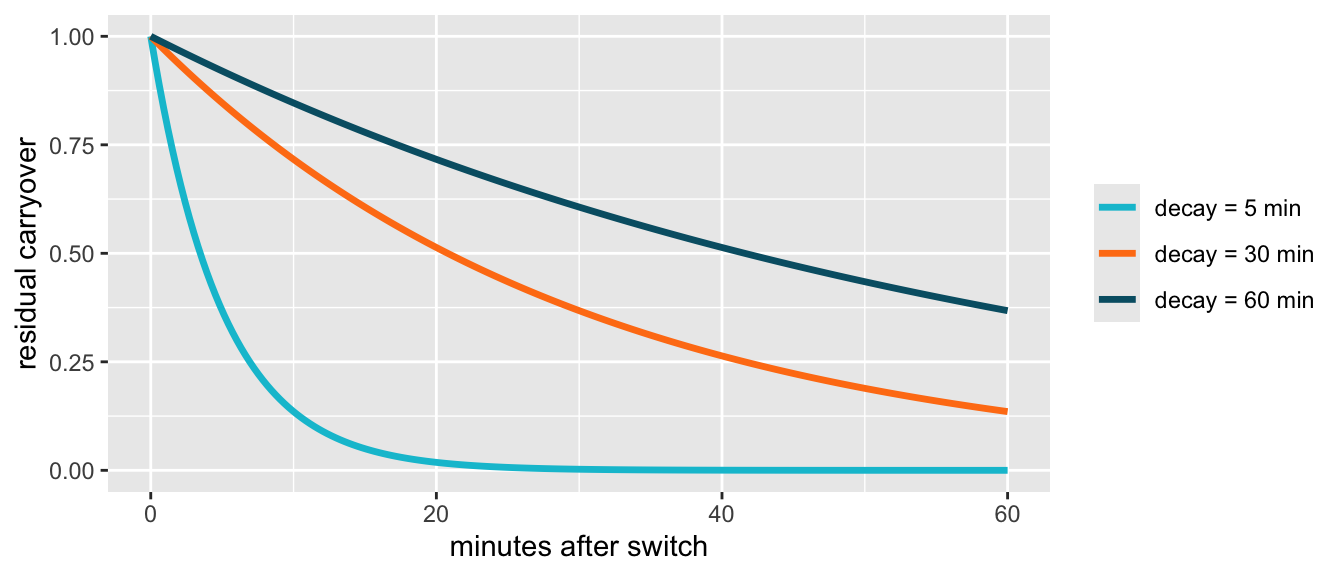
Hu and Wager (2022) show that the optimal switchback window length is a function of the carryover decay rate:

  • If treatment effect decays in \(\sim 5\) minutes, 30-minute windows capture ~80% of “clean” variance.
  • If decay is \(\sim 30\) minutes (slow carryover), 30-minute windows leave only ~50% clean; 2-hour windows are needed.
  • If decay is \(> 1\) hour (very slow carryover), switchback becomes infeasible — fall back to cluster-randomization.

Diagnostic: estimate carryover from a pilot study (50 random switches, measure the first 30 minutes); choose window length so residual carryover at end-of-window is below 5%.

Surrogate index: predict 63-day metric from 14-day proxies — Netflix

The long-horizon metric problem: business outcomes (retention, LTV, renewal) take months to observe; product decisions must happen in weeks.

Zhang et al. (2023) (Netflix): train a surrogate index \(\hat g(\mathbf{X}_{14d})\) to predict the 63-day metric from 14-day proxies; substitute \(\hat g\) for the true outcome at decision time.

The honest numbers

Reported Netflix results:

  • 95% agreement between surrogate-based and 63-day-truth decision when both reject the null in the same direction.
  • But only 65–79% recall of true launches — the surrogate misses 20–35% of real wins.
  • And it occasionally falsely launches when the 14-day signal points in the wrong direction.

Use with caution. Surrogate methods are decision-time savers, not bias-free estimators. The right framing: surrogate trades 75% of decision quality for 5× decision speed.

When A/B breaks: a diagnostic flowchart

A one-page reference card for any experiment showing “interesting” effects:

Diagnostic question Test If failed → which slide / design?
1. Is the allocation as intended? Chi-squared on counts vs. intended ratio. Slide 37–38 (SRM): STOP and debug.
2. Could treated affect untreated? DAG check: any \(D_i \to Y_j\) for \(i \neq j\)? Slide 39–40: cluster-randomize or switchback.
3. Is interference temporal? Pilot carryover study: 50 switches, 30-min decay. Slide 41–43: switchback with tuned window.
4. Is the outcome too slow? Decision-horizon \(\geq\) outcome-horizon? Slide 44: surrogate index + caveat.

Discipline first. Estimation second. No SRM check → no estimator.

What’s Next

A/B testing is the easy case. Observational data is the rest of the course.

Treatment effects vary — and tech firms exploit it: HTE in production

The ATE is a single number. The real treatment effect is a function \(\tau(x)\) of pre-treatment features. Tech firms increasingly exploit this:

  • Netflix HTE blog series (2024): firmware-dependent updates show different effects on smart-TV firmware versions; the firm rolls out the update only on firmwares where the effect is positive.
  • Country-level homepage variants: same A/B test, different ATE in 50+ countries → ship per-country.
  • Push-vs-email contact strategy: HTE on user-tenure variables → personalized contact policy.

Session 9 turns HTE into a formal estimator

In Session 9: Treatment Effect Heterogeneity, we cover causal forests, meta-learners, and the R-learner — the formal machinery that estimates \(\tau(x)\) from experimental data and supports per-segment ship decisions.

Bandits vs. A/B: when exploration trumps significance

Multi-armed bandits trade off exploration (try every arm to learn) against exploitation (route traffic to the best arm so far).

Bandit case studies (out of course scope)

  • Spotify 2025: contextual-bandit personalization for playlist recommendations.
  • Stitch Fix: bandits for inventory-recommendation strategy.
  • News publishers: Thompson Sampling for headline selection (3–10× faster than A/B at the same regret budget).

When A/B vs. when bandit:

  • A/B: one-shot launch decisions; need to interpret the effect.
  • Bandit: continuous-decision settings where you want to act on the effect, not interpret it.

Bandits are out of scope for this course — the formal theory needs a reinforcement-learning toolkit. But every year students ask, “Why not bandits for everything?” The answer: A/B testing remains the right tool when the value of understanding the effect exceeds the cost of not exploiting it during the experiment.

Geo-experiments: when individual randomization is impossible → S11

Some interventions cannot be randomized at user level:

  • Television and OOH advertising: ads are visible to everyone in a market; assignment is geographic by construction.
  • Marketing mix tests: spend changes across countries or DMAs, not individual users.
  • Regulatory or pricing rollouts: same price for everyone in a city.

Geo-experiment: randomize markets (DMAs, cities, countries) to treatment vs. control; estimate the effect as the difference in market-level outcomes, adjusting for market-level pre-treatment trends.

Session 11 covers the analysis method

When you have very few markets (5 treated vs. 5 control), naive difference-in-means is underpowered. Synthetic controls (Abadie et al.) construct a weighted control from the donor pool. That is Session 11.

Assignment II covers S04 + S05 (due 2026-05-31)

Assignment II is the second of five graded assignments (20% of final grade). Released after today’s lecture; due Sunday 31 May 2026, 23:59.

Assignment II — Online A/B-Test Reanalysis

You will be given a real or realistically simulated A/B-test dataset (~50,000 users, 2 arms, 14 days). Your task:

  1. SRM diagnostic — chi-squared check on assignment counts.
  2. OEC + guardrails — define and report.
  3. CUPED estimator — implement; report variance reduction vs. naive.
  4. One inference mode — fixed-horizon, sequential, or Bayesian. Justify the choice.
  5. Brief HTE exploration — segment by 1 covariate; report whether segment-level effects diverge.

Submission: rendered Quarto report (R or Python), code embedded.

The 15-minute paper quiz at the lecture session on Monday 2026-06-01 gates the grade — you must score ≥ 50% on the quiz or your report grade is capped at 60%. Quiz draws directly from today’s diagnostic and inference content (SRM, CUPED, peeking).

Five tools, one decision: trust the OEC, trust the diagnostics, trust the math

The session in three lines:

  • Variance reduction → more experiments per quarter. (CUPED, CUPAC, MLRATE.)
  • The right inference mode → defensible decisions under peeking. (Sequential, Bayesian, alpha-spending.)
  • SUTVA discipline → unbiased estimates at scale. (SRM check, cluster randomization, switchback, surrogate.)

Three families of tools, one operational discipline: define the OEC, run the diagnostics, choose the inference mode — in that order.

Next session: observed confounding — when you cannot randomize, what do you do instead?

References

Berman, Ron, and Christophe Van den Bulte. 2022. “False Discovery in A/B Testing.” Management Science 68 (9): 6762–82. https://doi.org/10.1287/mnsc.2021.4207.
Biswas, Dipayan, Annika Abell, and Roger Chacko. 2024. “Curvy Digital Marketing Designs: Virtual Elements with Rounded Shapes Enhance Online Click-Through Rates.” Journal of Consumer Research 51 (3): 552–75. https://doi.org/10.1093/jcr/ucad078.
Bojinov, Iavor, David Simchi-Levi, and Jinglong Zhao. 2023. “Design and Analysis of Switchback Experiments.” Management Science 69 (7): 3759–77. https://doi.org/10.1287/mnsc.2022.4583.
Deng, Alex, Ya Xu, Ron Kohavi, and Toby Walker. 2013. “Improving the Sensitivity of Online Controlled Experiments by Utilizing Pre-Experiment Data.” In Proceedings of the Sixth ACM International Conference on Web Search and Data Mining (WSDM), 123–32. https://doi.org/10.1145/2433396.2433413.
Fabijan, Aleksander, Jayant Gupchup, Somit Gupta, Jeff Omhover, Wen Qin, Lukas Vermeer, and Pavel Dmitriev. 2019. “Diagnosing Sample Ratio Mismatch in Online Controlled Experiments: A Taxonomy and Rules of Thumb for Practitioners.” In Proceedings of the 25th ACM SIGKDD International Conference on Knowledge Discovery and Data Mining (KDD), 2156–64. https://doi.org/10.1145/3292500.3330722.
Guo, Yongyi, Dominic Coey, Mikael Konutgan, Wenting Li, Chris Schoener, and Matt Goldman. 2021. “Machine Learning for Variance Reduction in Online Experiments.” In Advances in Neural Information Processing Systems 34 (NeurIPS). https://proceedings.neurips.cc/paper/2021/hash/488b084119a1c7a4950f00706ec7ea16-Abstract.html.
Holtz, David, Felipe Lobel, Ruben Lobel, Inessa Liskovich, and Sinan Aral. 2024. “Reducing Interference Bias in Online Marketplace Experiments Using Cluster Randomization: Evidence from a Pricing Meta-Experiment on Airbnb.” Management Science 71 (1). https://doi.org/10.1287/mnsc.2020.01157.
Howard, Steven R., Aaditya Ramdas, Jon McAuliffe, and Jasjeet Sekhon. 2021. “Time-Uniform, Nonparametric, Nonasymptotic Confidence Sequences.” The Annals of Statistics 49 (2): 1055–80. https://doi.org/10.1214/20-AOS1991.
Hu, Yuchen, and Stefan Wager. 2022. “Switchback Experiments Under Geometric Mixing.” https://arxiv.org/abs/2209.00197.
Kohavi, Ron, Alex Deng, Brian Frasca, Roger Longbotham, Toby Walker, and Ya Xu. 2012. “Trustworthy Online Controlled Experiments: Five Puzzling Outcomes Explained.” In Proceedings of the 18th ACM SIGKDD International Conference on Knowledge Discovery and Data Mining (KDD), 786–94. https://doi.org/10.1145/2339530.2339653.
Kohavi, Ron, Jakub Linowski, Lukas Vermeer, Fabrice Boisseranc, Joachim Furuseth, Andrew Gelman, Guido Imbens, and Ravikiran Rajagopal. 2026. “Power Analysis Is Essential: High-Powered Tests Suggest Minimal to No Effect of Rounded Shapes on Click-Through Rates.” Econ Journal Watch 23 (1): 138–60.
Kohavi, Ron, Diane Tang, and Ya Xu. 2020. Trustworthy Online Controlled Experiments: A Practical Guide to a/b Testing. Cambridge University Press. https://doi.org/10.1017/9781108653985.
Larsen, Nicholas, Jonathan Stallrich, Srijan Sengupta, Alex Deng, Ron Kohavi, and Nathaniel T. Stevens. 2024. “Statistical Challenges in Online Controlled Experiments: A Review of A/B Testing Methodology.” The American Statistician 78 (2): 135–49. https://doi.org/10.1080/00031305.2023.2257237.
Lin, Winston. 2013. “Agnostic Notes on Regression Adjustments to Experimental Data: Reexamining Freedman’s Critique.” Annals of Applied Statistics 7 (1): 295–318.
Lindon, Michael, Dae Woong Ham, Martin Tingley, and Iavor Bojinov. 2024. “Anytime-Valid Linear Models and Regression-Adjusted Causal Inference in Randomized Experiments.” https://arxiv.org/abs/2210.08589.
Waudby-Smith, Ian, and Aaditya Ramdas. 2024. “Estimating Means of Bounded Random Variables by Betting.” Journal of the Royal Statistical Society: Series B 86 (1): 1–27. https://doi.org/10.1093/jrsssb/qkad009.
Zhang, Vickie, Michael Zhao, Maria Dimakopoulou, Anh Le, and Nathan Kallus. 2023. “Evaluating the Surrogate Index as a Decision-Making Tool Using 200 A/B Tests at Netflix.” https://arxiv.org/abs/2311.11922.
Thank you for your attention!