3. Causal Graphs and Discovery

Causal Data Science for Business Analytics

Christoph Ihl

Hamburg University of Technology

Tuesday, 28. April 2026

The Backdoor Criterion

The backdoor criterion translates d-separation into an actionable adjustment strategy

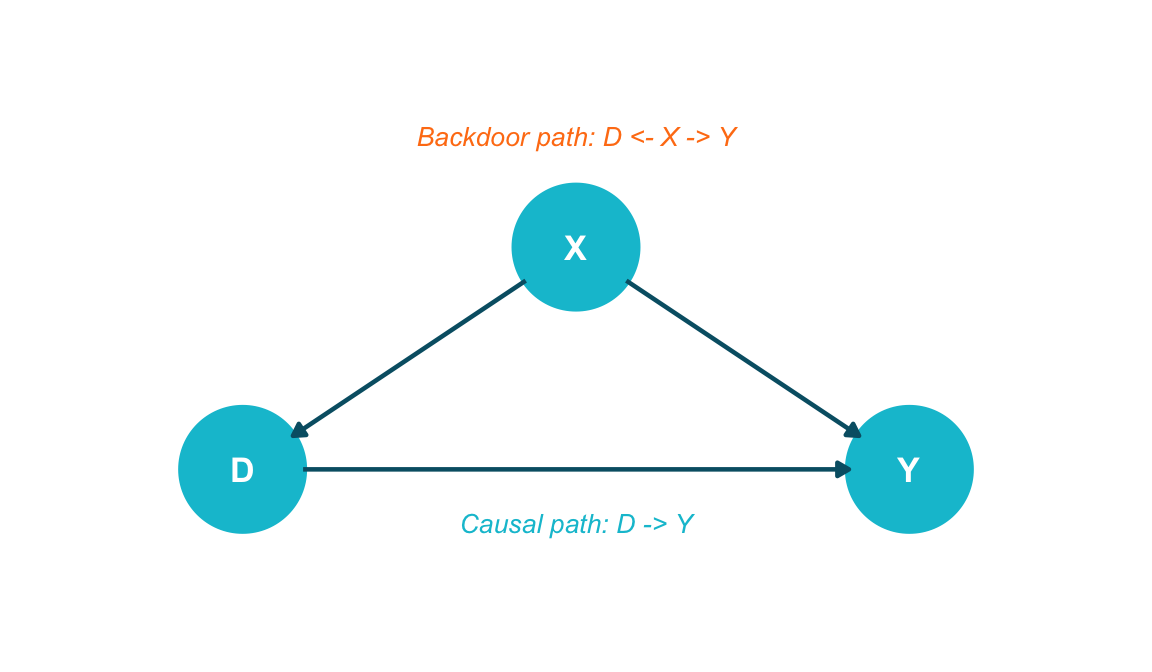
Backdoor paths are the source of confounding bias

A backdoor path from \(D\) to \(Y\) is any path that starts with an arrow into \(D\) (i.e., \(D \leftarrow \ldots\)).


These paths are non-causal — they transmit spurious association due to confounding, not genuine causal effects.


A causal (directed) path from \(D\) to \(Y\) follows arrows forward: \(D \rightarrow \ldots \rightarrow Y\).


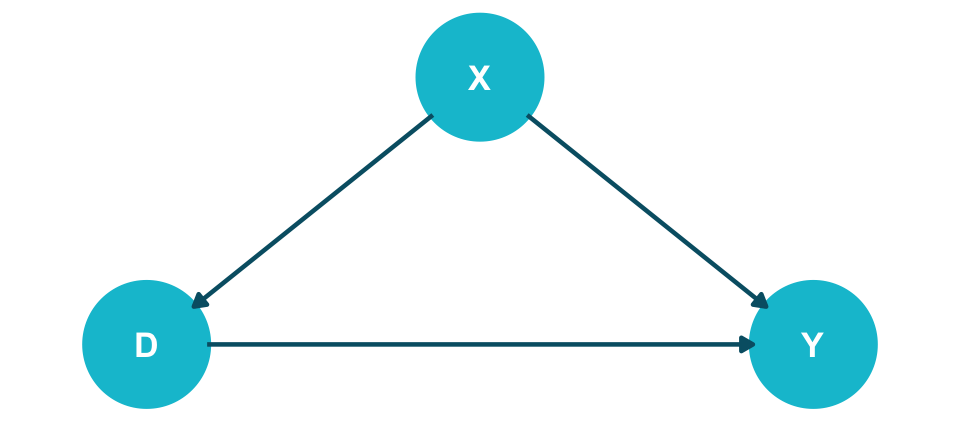
Business example: Marketing spend (\(D\)) \(\rightarrow\) Revenue (\(Y\)), with company size (\(X\)) as confounder: \(D \leftarrow X \rightarrow Y\). Larger firms spend more on marketing AND earn more revenue.

Show code
library(ggdag)
library(ggplot2)

coord_dag <- list(
  x = c(D = 0, X = 0.5, Y = 1),
  y = c(D = 0, X = 0.5, Y = 0)
)

dag <- dagify(D ~ X,
              Y ~ D,
              Y ~ X,
              coords = coord_dag)

dag_data <- dag |> tidy_dagitty()

dag_data |>
  ggplot(aes(x = x, y = y, xend = xend, yend = yend)) +
  geom_dag_point(colour = "#00C1D4", size = 22) +
  geom_dag_edges(edge_colour = "#005e73", edge_width = 0.8) +
  geom_dag_text(colour = "white", size = 4.5, fontface = "bold") +
  annotate("text", x = 0.5, y = -0.12, label = "Causal path: D -> Y",
           colour = "#00C1D4", size = 3.5, fontface = "italic") +
  annotate("text", x = 0.5, y = 0.75, label = "Backdoor path: D <- X -> Y",
           colour = "#FF7E15", size = 3.5, fontface = "italic") +
  expand_limits(x = c(-0.2, 1.2), y = c(-0.3, 0.9)) +
  coord_cartesian(clip = "off") +
  theme_dag(legend.position = "none")

The backdoor criterion tells you exactly what to condition on

Backdoor Criterion (Pearl, 1993)

A set of variables \(X\) satisfies the backdoor criterion relative to \((D, Y)\) if:

  1. \(X\) blocks all backdoor paths from \(D\) to \(Y\)
  2. \(X\) contains no descendant of \(D\)

If \(X\) satisfies the backdoor criterion, then the causal effect is identified by the adjustment formula from Session 01 — now with a graphical justification for choosing \(X\) (Pearl 2009):

\[\tau = \sum_x \Big(\mathbb{E}[Y \mid D = 1, X = x] - \mathbb{E}[Y \mid D = 0, X = x]\Big)\,\textcolor{#FF7E15}{P(X = x)}\]

The backdoor criterion guarantees that this observational formula identifies a causal effect — averaging the conditional contrasts with the natural weight \(\textcolor{#FF7E15}{P(X)}\), the orange weight from the previous derivation. Two frameworks formalize what that causal quantity is — derivation on the next slide.

Backdoor adjustment connects DAGs to potential outcomes

do-notation (Pearl):

Step 1 — backdoor criterion ⇒ truncated factorization at \(D = d\): \[P(X, Y \mid do(D = d)) = P(Y \mid D = d, X)\,\textcolor{#FF7E15}{P(X)}\]

Step 2 — sum over \(x\) (graph surgery preserves the kernel): \[E[Y \mid do(D = d)] = \sum_x E[Y \mid D = d, X = x]\,\textcolor{#FF7E15}{P(X = x)}\]

Natural weight \(\textcolor{#FF7E15}{P(X)}\) — the single-confounder argument generalized to a sufficient set \(X\).

Potential outcomes (Rubin):

Step 1 — conditional exchangeability \(Y(d) \perp\!\!\!\perp D \mid X\): \[E[Y(d) \mid X = x] = E[Y \mid D = d, X = x]\]

Step 2 — law of total expectation over \(\textcolor{#FF7E15}{P(X)}\): \[E[Y(d)] = \sum_x E[Y \mid D = d, X = x]\,\textcolor{#FF7E15}{P(X = x)}\]

Natural weight \(\textcolor{#FF7E15}{P(X)}\) — emerges from marginalizing the population.

Bridge: \(X\) satisfies the backdoor criterion in the DAG \(\iff\) \((Y(1), Y(0)) \perp\!\!\!\perp D \mid X\) (conditional exchangeability) (Hünermund and Bareinboim 2023). Two routes, same kernel \(E[Y \mid D = d, X]\), same orange weight \(\textcolor{#FF7E15}{P(X)}\). DAGs help find \(X\); potential outcomes define the estimand.

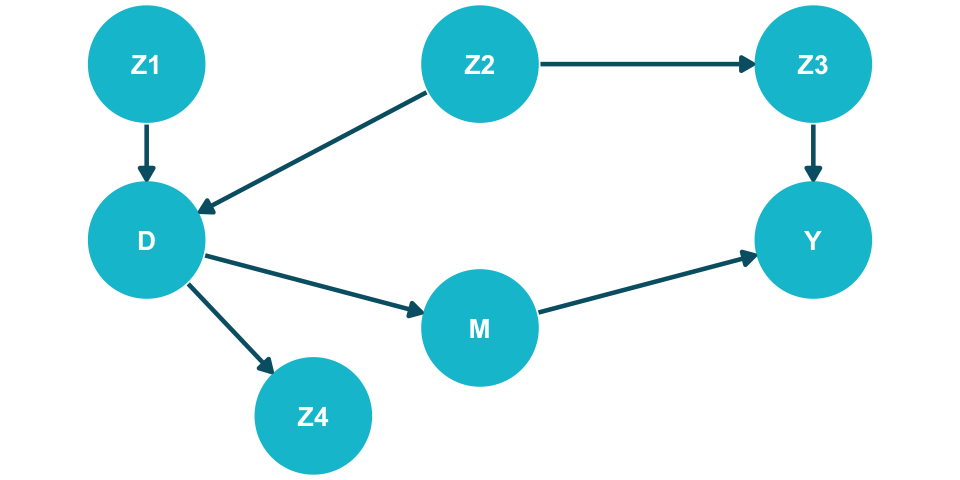
Worked example: finding adjustment sets in a complex DAG

Show code
library(ggdag)
library(ggplot2)

coord_dag <- list(
  x = c(Z1 = 0, Z2 = 0.5, D = 0, M = 0.5, Y = 1, Z3 = 1, Z4 = 0.25),
  y = c(Z1 = 1, Z2 = 1, D = 0.5, M = 0.25, Y = 0.5, Z3 = 1, Z4 = 0)
)

dag <- dagify(
  D ~ Z1,
  D ~ Z2,
  Z3 ~ Z2,
  M ~ D,
  Y ~ M,
  Y ~ Z3,
  Z4 ~ D,
  coords = coord_dag
)

dag |>
  ggplot(aes(x = x, y = y, xend = xend, yend = yend)) +
  geom_dag_point(colour = "#00C1D4", size = 20) +
  geom_dag_edges(edge_colour = "#005e73", edge_width = 0.8) +
  geom_dag_text(colour = "white", size = 3.5, fontface = "bold") +
  expand_limits(x = c(-0.1, 1.1), y = c(-0.1, 1.1)) +
  coord_cartesian(clip = "off") +
  theme_dag(legend.position = "none") +
  theme(plot.margin = margin(-5, 0, -5, 0))

Show code
library(dagitty)
dag <- dagitty("dag{
  Z1 -> D; Z2 -> D; Z2 -> Z3;
  D -> M -> Y; Z3 -> Y; D -> Z4
}")
print(adjustmentSets(dag, exposure = "D", outcome = "Y"))
{ Z3 }
{ Z2 }
Show code
from pgmpy.base import DAG
from pgmpy.inference import CausalInference

dag = DAG([
    ("Z1", "D"), ("Z2", "D"), ("Z2", "Z3"),
    ("D", "M"), ("M", "Y"), ("Z3", "Y"), ("D", "Z4")
])
ci = CausalInference(dag)
print(ci.get_all_backdoor_adjustment_sets("D", "Y"))
frozenset({frozenset({'Z3'}), frozenset({'Z2'})})

Backdoor paths from \(D\) to \(Y\):

  1. \(D \leftarrow Z2 \rightarrow Z3 \rightarrow Y\) (open fork at Z2)
  2. \(D \leftarrow Z1 \; \ldots\) (Z1 has no path to Y — dead end)

Only path 1 needs blocking. Exclude \(M\) (mediator — conditioning blocks the causal path) and \(Z4\) (descendant of \(D\) — may open collider paths).


Multiple valid sets exist: \(\{Z2\}\), \(\{Z3\}\), \(\{Z2, Z3\}\), \(\{Z1, Z2\}\), etc. The minimal sufficient set is often preferred (fewer variables \(=\) less variance).

Common mistakes: four DAG patterns that trap analysts

1. Adjusting for a mediator

\(D \rightarrow M \rightarrow Y\)

Conditioning on \(M\) blocks the causal pathway, underestimating the total effect.


2. Adjusting for a collider

\(D \rightarrow Z \leftarrow Y\)   (conditioning on \(Z\))

Opens a spurious path, creating bias where none existed.

3. Adjusting for a descendant of treatment

\(D \rightarrow Z \rightarrow \ldots\)

Partially blocks the causal pathway and may open collider paths.


4. Failing to adjust for a confounder

\(D \leftarrow W \rightarrow Y\)   (not conditioning on \(W\))

Leaves the backdoor path open — the classic omitted variable bias.


All four mistakes are prevented by drawing a DAG and applying the backdoor criterion before running any regression.

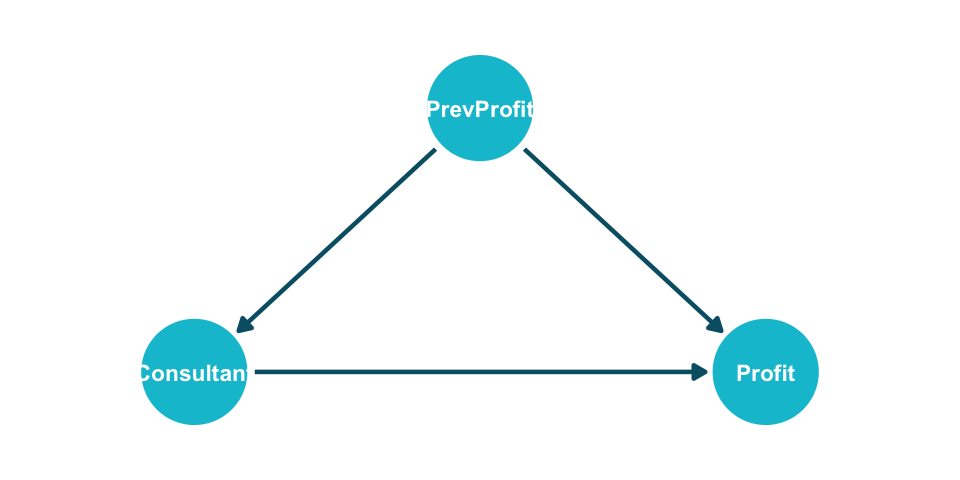
Applied example: estimating the effect of consulting on profits

Show code: DAG + adjustment set
library(ggdag); library(dagitty)

dag <- dagify(Consultant ~ PrevProfit,
              Profit ~ Consultant + PrevProfit,
              exposure = "Consultant",
              outcome = "Profit")

ggdag(dag) # plot DAG
adjustmentSets(dag) # find valid sets
Show code: DAG + adjustment set
from pgmpy.base import DAG
from pgmpy.inference import CausalInference

dag = DAG([("PrevProfit", "Consultant"),
           ("Consultant", "Profit"),
           ("PrevProfit", "Profit")])

ci = CausalInference(dag)
ci.get_all_backdoor_adjustment_sets(
    "Consultant", "Profit")

{ PrevProfit }
Show code: simulation + estimation
library(dplyr)

# Simulate data
set.seed(42); n <- 1000
previous_profit <- rnorm(n, 5, 2) + 2 * rbinom(n, 1, 0.3)
consultant <- rbinom(n, 1, ifelse(previous_profit >
                     median(previous_profit), 0.75, 0.25))
profit <- 0.85 * previous_profit + 1 * consultant +
          rnorm(n, 0, 0.1)

# Naive vs. adjusted ATE
naive <- mean(profit[consultant == 1]) -
         mean(profit[consultant == 0])
stratum <- ntile(previous_profit, 4)
adjusted <- mean(tapply(seq_len(n), stratum, \(i)
  mean(profit[i][consultant[i] == 1]) -
  mean(profit[i][consultant[i] == 0])))
Show code: simulation + estimation
import numpy as np
import pandas as pd

np.random.seed(42); n = 1000
prev = np.random.normal(5, 2, n) + 2 * np.random.binomial(1, 0.3, n)
prob = np.where(prev > np.median(prev), 0.75, 0.25)
cons = np.random.binomial(1, prob)
profit = 0.85 * prev + 1 * cons + np.random.normal(0, 0.1, n)

# Naive vs. adjusted ATE
naive = profit[cons == 1].mean() - profit[cons == 0].mean()
df = pd.DataFrame({"prev": prev, "cons": cons, "profit": profit})
df["q"] = pd.qcut(df["prev"], 4, labels=False)
adj = df.groupby("q").apply(
    lambda g: g.loc[g.cons == 1, "profit"].mean() -
              g.loc[g.cons == 0, "profit"].mean()).mean()
Naive ATE (no adjustment):       2.32 
Adjusted ATE (stratified):        0.99 
True causal effect:               1.00

Previous profit confounds the comparison: profitable firms hire more consultants AND earn more. The naive estimate is biased upward; adjusting recovers the true effect.

The Frontdoor Criterion

The backdoor criterion is powerful — but not complete. When confounders are unobserved, no ML algorithm will ever solve this problem.

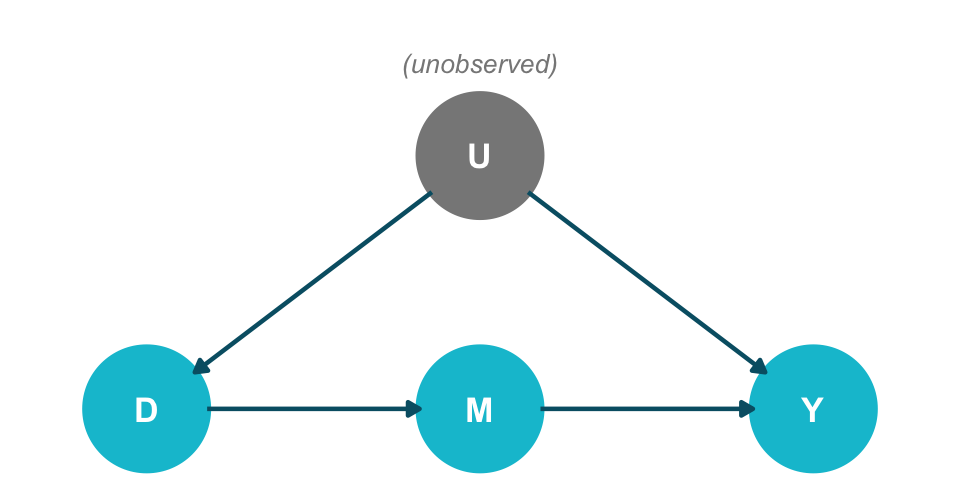
Frontdoor adjustment: identifying effects through a mediator

Example: Social media (\(D\)) \(\rightarrow\) word-of-mouth (\(M\)) \(\rightarrow\) sales (\(Y\)), brand awareness (\(U\)) unobserved.

Show code
library(ggdag)
library(ggplot2)

coord_dag <- list(
  x = c(D = 0, M = 0.5, Y = 1, U = 0.5),
  y = c(D = 0, M = 0, Y = 0, U = 0.6)
)

dag <- dagify(M ~ D,
              Y ~ M,
              D ~ U,
              Y ~ U,
              coords = coord_dag)

dag_data <- dag |> tidy_dagitty()
dag_data$data$colour <- ifelse(dag_data$data$name == "U", "#888888", "#00C1D4")

dag_data |>
  ggplot(aes(x = x, y = y, xend = xend, yend = yend)) +
  geom_dag_point(aes(colour = colour), size = 22) +
  scale_colour_identity() +
  geom_dag_edges(edge_colour = "#005e73", edge_width = 0.8) +
  geom_dag_text(colour = "white", size = 4.5, fontface = "bold") +
  annotate("text", x = 0.5, y = 0.82, label = "(unobserved)",
           colour = "#888888", size = 3.5, fontface = "italic") +
  expand_limits(x = c(-0.1, 1.1), y = c(-0.1, 0.9)) +
  coord_cartesian(clip = "off") +
  theme_dag(legend.position = "none") +
  theme(plot.margin = margin(-5, 0, -5, 0))

  • \(U\) is unobserved — backdoor adjustment is impossible.
  • But \(M\) fully mediates the effect of \(D\) on \(Y\): every causal path from \(D\) to \(Y\) runs through \(M\).
  • Idea: isolate the causal flow that travels along the directed paths \(D \rightarrow M \rightarrow Y\), splitting an un-identifiable problem into two identifiable pieces.
  • \(M\) satisfies the frontdoor criterion — the second major identification strategy.

Frontdoor in three steps

Step 1: Identify \(D \rightarrow M\).

The only backdoor path \(D \leftarrow U \rightarrow Y \leftarrow M\) contains a collider at \(Y\). Blocked. So \[P(M \mid do(D = d)) = P(M \mid D = d).\]

Step 2: Identify \(M \rightarrow Y\).

Backdoor path: \(M \leftarrow D \leftarrow U \rightarrow Y\). Condition on \(D\) to block it. So \[P(Y \mid do(M = m)) = \sum_{d} P(Y \mid M = m, D = d)\,P(D = d).\]

Step 3: Combine the two do-free quantities.

Sum over all realizations \(m\) of \(P(M \mid do(D = d))\): \[P(Y \mid do(D = d)) = \sum_{m} P(M = m \mid D = d) \sum_{d'} P(Y \mid M = m, D = d')\,P(D = d').\]

Frontdoor criterion: theorem and definition

Combining the do-free quantities yields a closed-form expression in only observed variables:

Theorem: Frontdoor Adjustment

If \((D, M, Y)\) satisfies the frontdoor criterion and positivity, then \[P(Y \mid do(D = d)) = \sum_{m} P(M = m \mid D = d) \sum_{d'} P(Y \mid M = m, D = d')\,P(D = d').\]

Definition: Frontdoor Criterion

A variable \(M\) satisfies the frontdoor criterion relative to \((D, Y)\) if:

  1. \(M\) completely mediates the effect of \(D\) on \(Y\) — every directed path from \(D\) to \(Y\) passes through \(M\).
  2. There is no unblocked backdoor path from \(D\) to \(M\).
  3. All backdoor paths from \(M\) to \(Y\) are blocked by \(D\).

do-Calculus and the Causal Hierarchy

Three rules systematically remove do-operators from any causal expression

Two surgeries for the rules: \(G_{\overline{X}}\) and \(G_{\underline{X}}\)

Observational graph \(G\):

When we simply observe \(D\), all arrows remain. \(D\) is determined by its causes (including confounders).

Mutilated graph \(G_{\overline{D}}\):

When we intervene on \(D\) (set \(D = d\)), we delete all arrows into \(D\). The intervention replaces whatever normally determines \(D\).

The do-operator is concrete: \(P(Y \mid do(D = d))\) is simply \(P(Y \mid D = d)\) in the mutilated graph \(G_{\overline{D}}\). Graph surgery severs the confounding, making \(D\) independent of \(X\). This is exactly what an RCT does in practice.

Two surgeries, two notations: \(G_{\overline{X}}\) deletes arrows into \(X\) (used for Rules 1 & 3); \(G_{\underline{X}}\) deletes arrows out of \(X\) (used in Rule 2 to test whether observation can replace intervention).

Rule 1: Irrelevant observations can be dropped

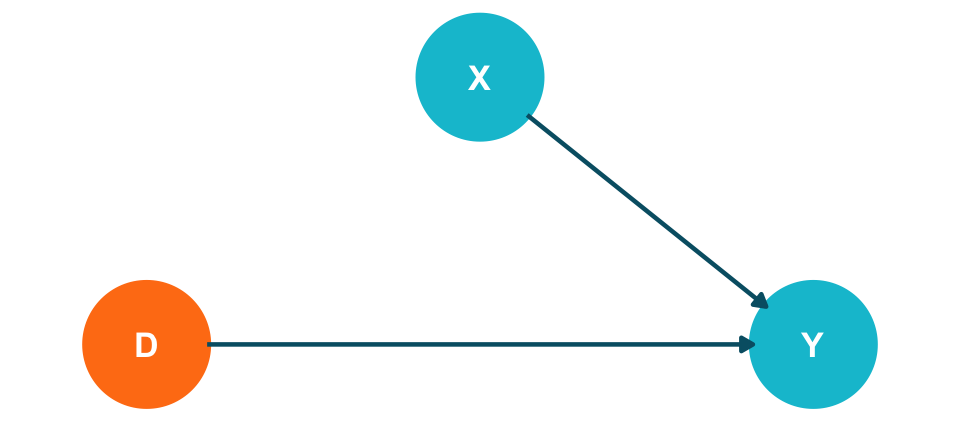
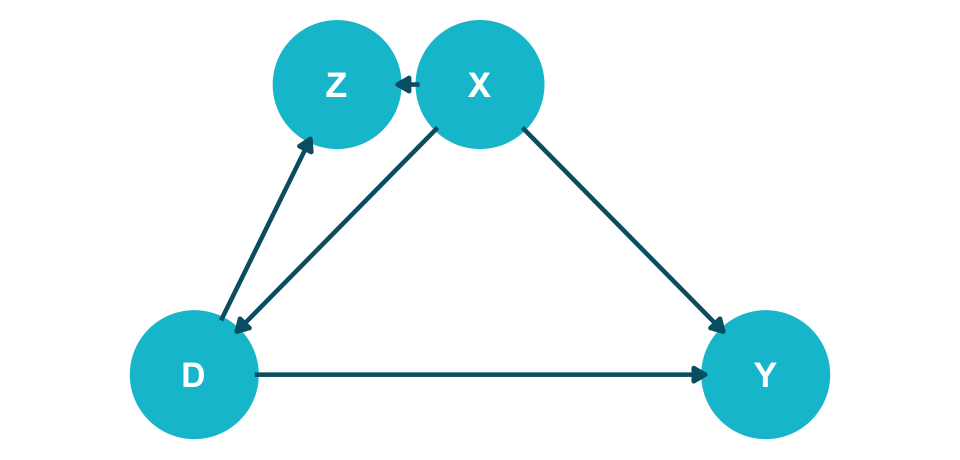
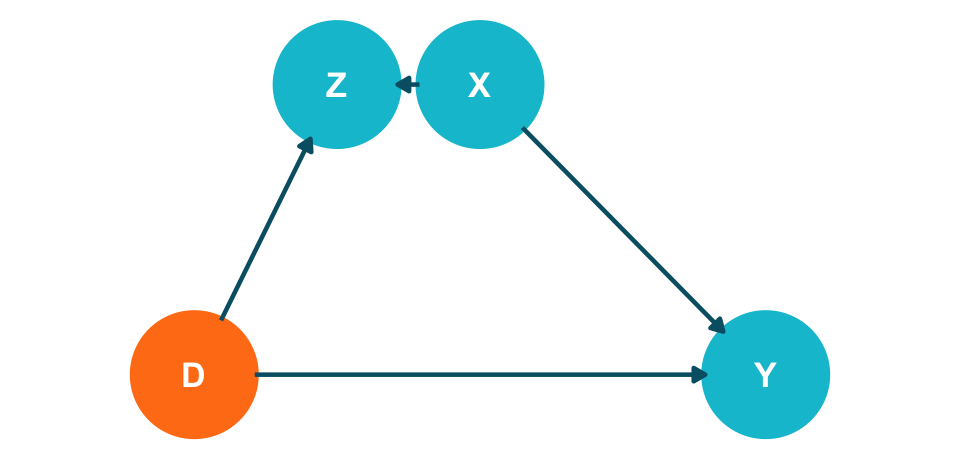
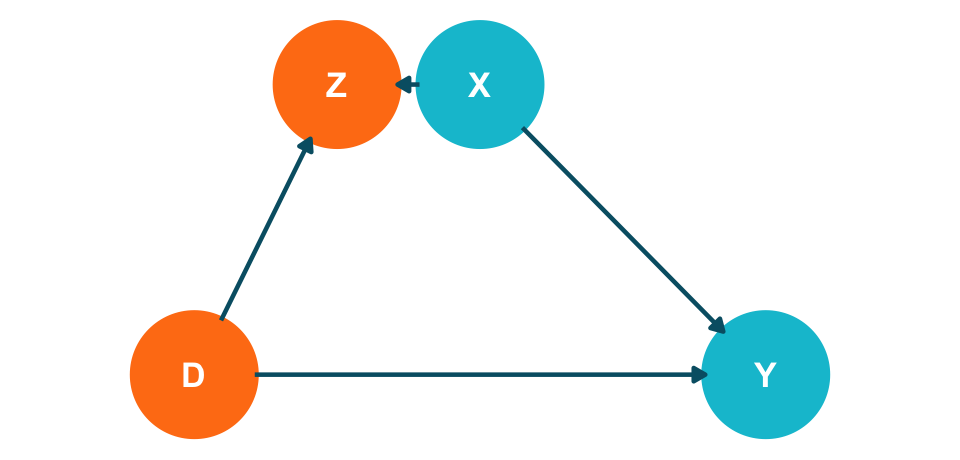
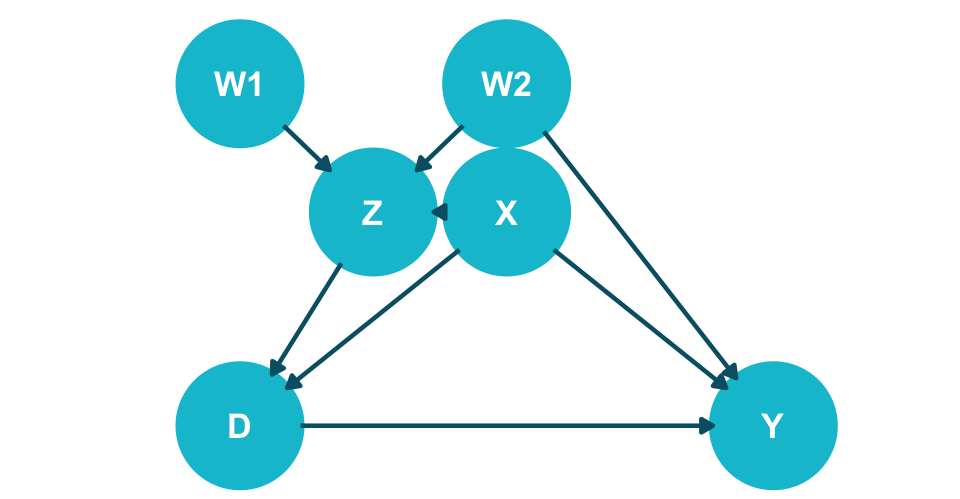
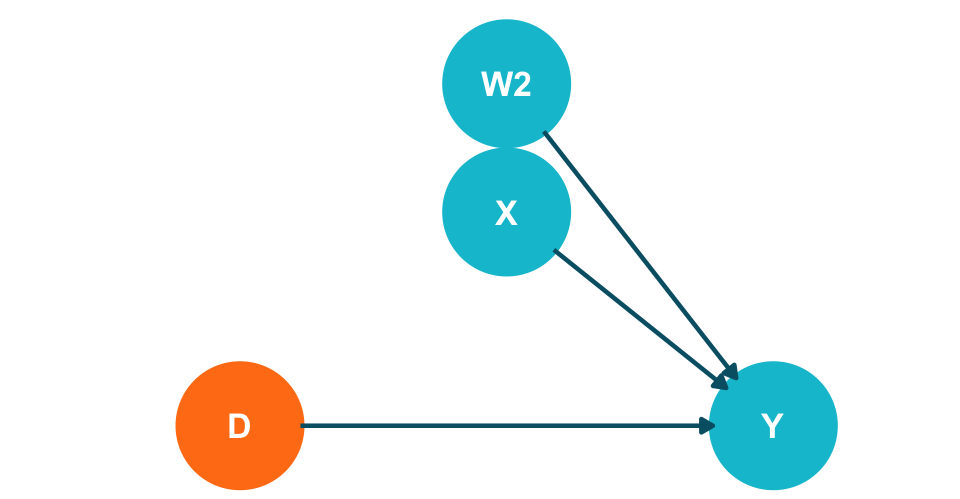
Rule: If \(Y \perp\!\!\!\perp_{G_{\overline{D}}} Z \mid D, X\), then \(P(Y \mid do(D), Z, X) = P(Y \mid do(D), X)\)

Check in \(G_{\overline{D}}\) (delete arrows into \(D\)): if \(Z\) is d-separated from \(Y\), observing \(Z\) adds nothing.

Original graph \(G\):

\(\Rightarrow\)

\(G_{\overline{D}}\) (delete arrows into \(D\)):

If \(X\) and \(D\) d-separate \(Z\) from \(Y\) in \(G_{\overline{D}}\), then conditioning on \(X\) and \(D\) makes \(Z\) irrelevant for predicting \(Y\) — observing \(Z\) adds no information.

Rule 2: Interventions can become observations

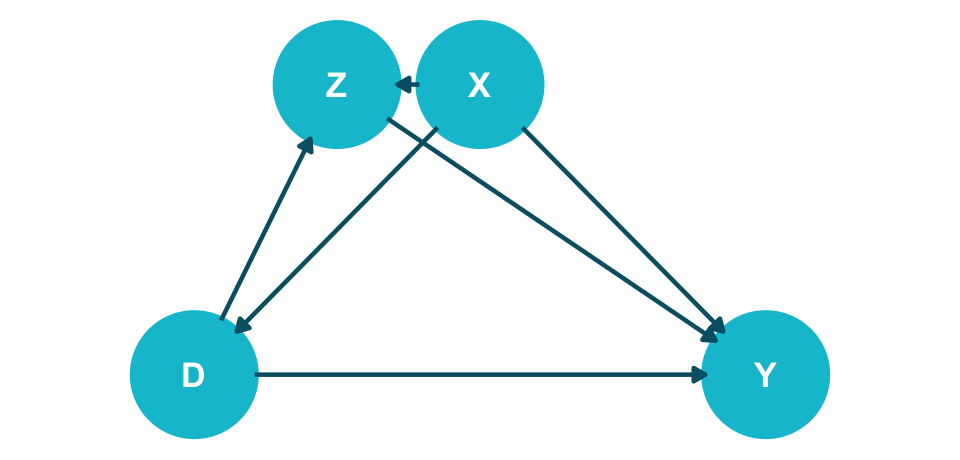
Rule: If \(Y \perp\!\!\!\perp_{G_{\overline{D},\, \underline{Z}}} Z \mid D, X\), then \(P(Y \mid do(D), do(Z), X) = P(Y \mid do(D), Z, X)\)

Check in \(G_{\overline{D},\, \underline{Z}}\) (delete into \(D\), out of \(Z\)): if confounding of \(Z\) on \(Y\) is blocked, replace \(do(Z)\) with observation.

Original graph \(G\):

\(\Rightarrow\)

\(G_{\overline{D},\, \underline{Z}}\) (delete into \(D\), out of \(Z\)):

\(Z \rightarrow Y\) deleted, arrows into \(D\) deleted. If \(X\) and \(D\) d-separate \(Z\) from \(Y\) in \(G_{\overline{D},\, \underline{Z}}\), then \(do(Z)\) can safely become observation of \(Z\). This is the workhorse rule that converts interventional quantities into observational ones.

Rule 3: Irrelevant interventions can be dropped

Rule: If \(Y \perp\!\!\!\perp_{G_{\overline{D},\, \overline{Z(X)}}} Z \mid D, X\), then \(P(Y \mid do(D), do(Z), X) = P(Y \mid do(D), X)\)

Check in \(G_{\overline{D},\, \overline{Z}}\) (delete into \(D\), into \(Z\)): if \(Z\) cannot reach \(Y\), intervening on \(Z\) is pointless. \(Z(X)\): the subset of \(Z\) nodes that are not ancestors of any \(X\)-node in \(G_{\overline{D}}\).

Original graph \(G\):

\(\Rightarrow\)

\(G_{\overline{D},\, \overline{Z}}\) (delete into \(D\), into \(Z\)):

For all \(Z\) that are not ancestors of any \(X\) we condition on, we can delete all edges into \(Z\). If in \(G_{\overline{D},\, \overline{Z(X)}}\) the variable \(Z\) is (conditionally) independent of \(Y\), the do-operator for \(Z\) can be ignored.

The three rules of do-calculus — summary

Graph notation: \(G_{\overline{X}}\) = delete arrows into \(X\); \(G_{\underline{X}}\) = delete arrows out of \(X\).

Rule Formal statement Graphical condition Plain English
R1 \(P(Y \mid do(D), Z, X) = P(Y \mid do(D), X)\) \(Y \perp\!\!\!\perp_{G_{\overline{D}}} Z \mid D, X\) Irrelevant observations can be dropped.
R2 \(P(Y \mid do(D), do(Z), X) = P(Y \mid do(D), Z, X)\) \(Y \perp\!\!\!\perp_{G_{\overline{D},\, \underline{Z}}} Z \mid D, X\) Intervention \(\rightarrow\) observation when confounding is blocked.
R3 \(P(Y \mid do(D), do(Z), X) = P(Y \mid do(D), X)\) \(Y \perp\!\!\!\perp_{G_{\overline{D},\, \overline{Z(X)}}} Z \mid D, X\) Irrelevant interventions can be dropped.

Applying do-Calculus: the college wage premium

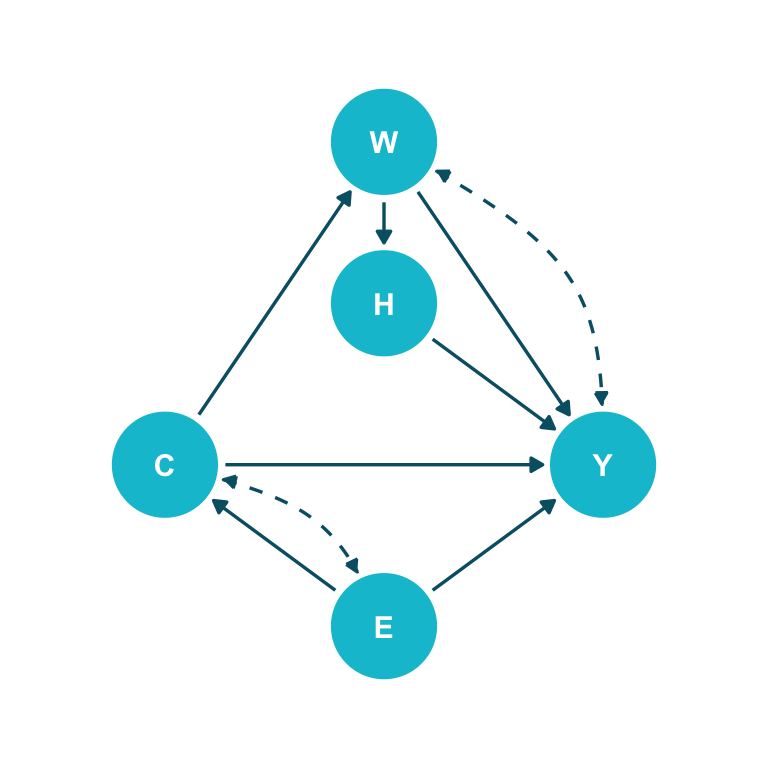
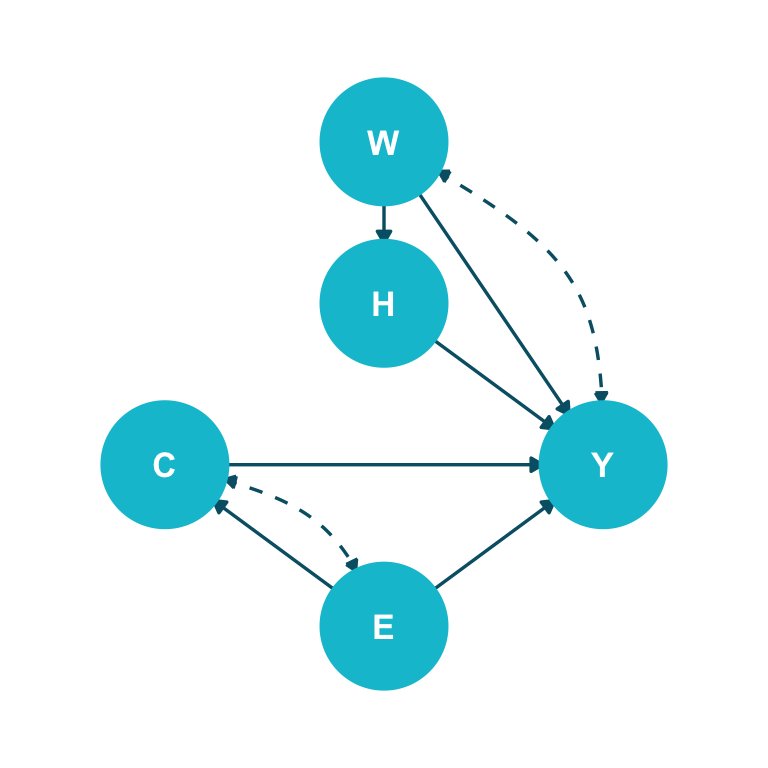
Stylized example of the college wage premium:

  • \(C\): college degree
  • \(Y\): earnings
  • \(W\): occupation
  • \(H\): work-related health
  • \(E\): other socio-economic factors
  • Dashed arrows: unobserved confounders

Task: Transform \(P(y \mid do(c))\) into a do-free expression by using the rules of do-calculus.

Causal Graph \(G\):

Step 1: Two backdoor paths in \(G\) can be blocked by \(E\). Conditioning and summing over all values of \(E\): \[P(y \mid do(c)) = \sum_{e} P(y \mid do(c), e)\, P(e \mid do(c))\]

Applying do-Calculus: the college wage premium

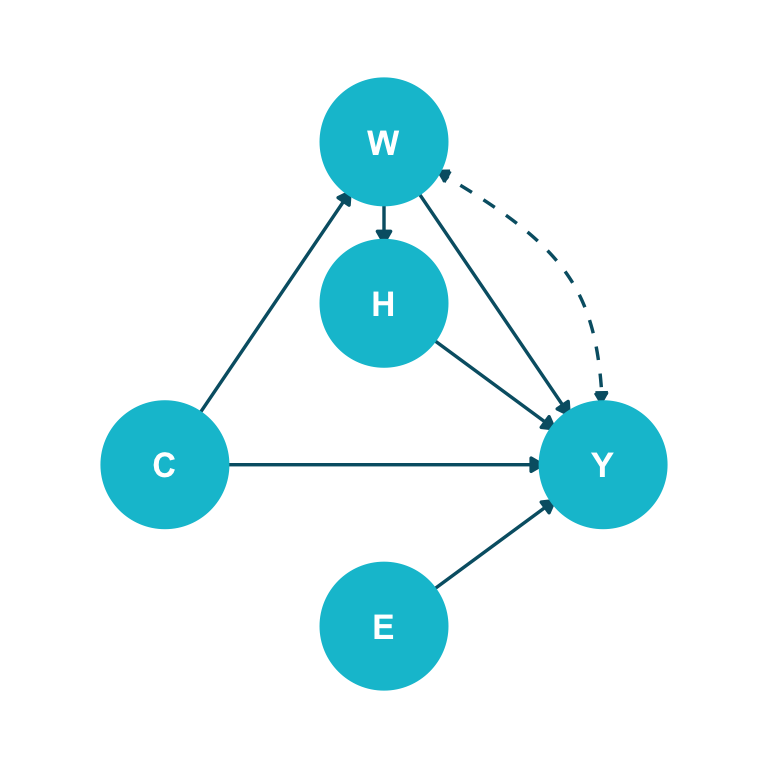
Step 2: Apply Rule 2 of do-calculus: \[P(y \mid do(c), e) = P(y \mid c, e) \quad\text{since}\quad Y \perp\!\!\!\perp_{G_{\underline{C}}} C \mid E\]

Manipulated Graph \(G_{\underline{C}}\):

Step 3: Apply Rule 3 of do-calculus: \[P(e \mid do(c)) = P(e) \quad\text{since}\quad E \perp\!\!\!\perp_{G_{\overline{C}}} C\]

Manipulated Graph \(G_{\overline{C}}\):

“Do-free” expression: \(P(y \mid do(c)) = \sum_{e} P(y \mid do(c), e)\,P(e \mid do(c)) = \sum_{e} P(y \mid c, e)\,P(e)\)

do-calculus is complete: if identification is possible, the rules find it

Completeness of do-Calculus (Huang & Valtorta 2006; Shpitser & Pearl 2006)

For any DAG \(G\) and any causal query \(P(Y \mid do(D))\):

  • Either do-calculus can derive an identifying expression from observational distributions, or
  • No such expression exists (the effect is not identifiable from observational data)

The three rules are all you need. Nothing is left on the table.


Practical implications:

  • The ID algorithm (Shpitser and Pearl 2006) automates the application of do-calculus rules
  • Software: causaleffect R package, dagitty, DoWhy (Python)
  • You do not need to memorize or manually apply the three rules — software does it
  • But understanding the logic helps you draw better DAGs and interpret the results

Pearl’s Causal Hierarchy separates seeing, doing, and imagining

Layer Name Typical query Notation Example
L3 Counterfactual “What would have happened?” \(P(Y_d \mid D = d', Y = y')\) Would this patient have survived under treatment, given they died without it?
L2 Intervention “What happens if we act?” \(P(Y \mid do(D = d))\) What is the expected revenue if we set the ad budget to 100K?
L1 Association “What do we observe?” \(P(Y \mid D = d)\) Customers who saw the ad bought more. Is the ad effective?

Causal Hierarchy Theorem (Bareinboim et al. 2022): Data at layer \(L_k\) cannot answer queries at layer \(L_{k+1}\) without additional assumptions or structure.

Causal Discovery

Identification assumes the DAG. Where does the DAG come from?

DAGs are hypotheses, not data

A DAG encodes a causal hypothesis about how variables generate one another. It is the input to identification, not its output. Three sources fill that input:

Domain expertise

Subject-matter experts draw the graph from theory, mechanism, and prior studies. Strength: encodes substantive knowledge data alone cannot reveal. Weakness: experts disagree; biases creep in; some edges are simply unknown.

Experiments

A randomized intervention on \(D\) severs all incoming edges, isolating the effect \(D \to Y\). Strength: establishes individual edges by design. Weakness: expensive, slow, often infeasible (ethics, cost, scale).

Discovery from data

Algorithms search for graphs consistent with the observed conditional independencies (or the best-scoring fit). Strength: uses what we already have — observational data. Weakness: identifies a class of graphs, not always a unique one; assumption-heavy.

In practice, all three are combined: discovery proposes, expertise edits, experiments confirm.

What can data alone tell us about the DAG?

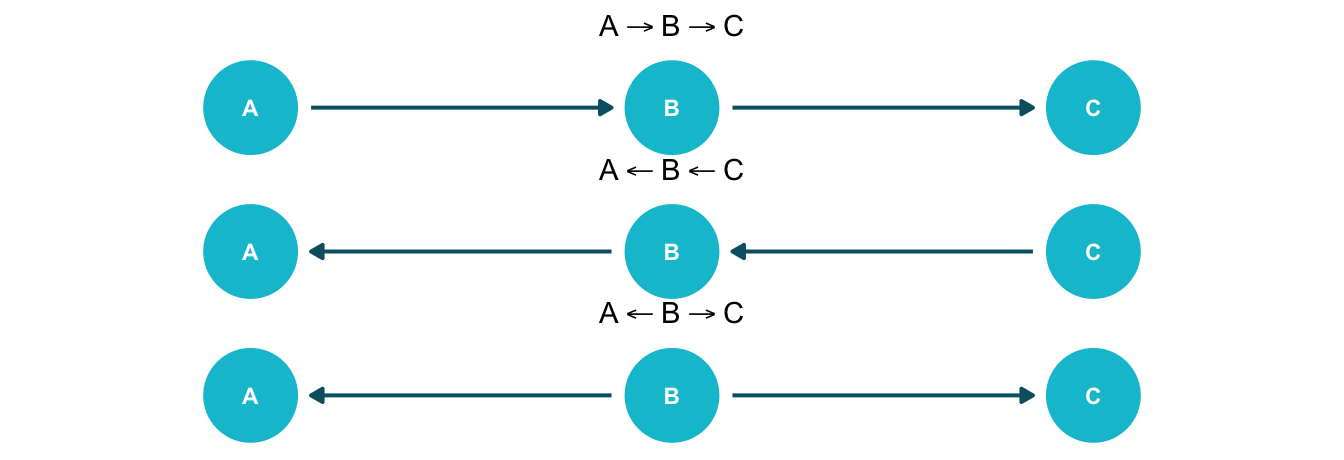
The Markov equivalence problem. Consider three DAGs over \(\{A, B, C\}\):

All three imply the same CI: \(A \perp\!\!\!\perp C \mid B\). Observational data cannot tell them apart.

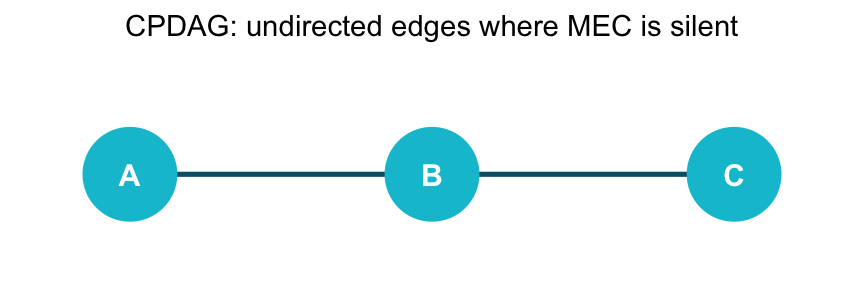
Markov equivalence class (MEC). DAGs that imply the same set of conditional independencies form an equivalence class. Discovery from observational data can recover the MEC — but no single member of it.

CPDAG (Completed Partially Directed Acyclic Graph) = the MEC’s graphical signature: directed edges where orientation is identified, undirected edges where it is not.

Punchline: discovery from observational data ⟹ a CPDAG, not a unique DAG. To go further, we need either an extra assumption (LiNGAM) or experimental data.

Three families of causal-discovery algorithms

Family Central question Output Key assumption Examples
Constraint-based Which conditional independencies hold in the data? CPDAG (or PAG with latents) Faithfulness PC, FCI
Score-based Which DAG fits the data best under a score (BIC, BDe)? CPDAG Score consistency GES, GIES
Functional / non-Gaussian Can asymmetries in the noise distribution break the MEC tie? Unique DAG Linearity + non-Gaussian noise (or nonlinearity) LiNGAM, ANM

We will walk PC in detail (the canonical example), then sketch GES and LiNGAM at conceptual depth.

PC algorithm: discover the skeleton, then orient

PC (Spirtes, Glymour, and Scheines 2000) turns the d-separation criterion backwards: starting from “everything is connected”, remove edges as conditional independencies are detected, then orient as far as the data allows.

Phase 1 — Skeleton

Begin with the complete undirected graph. For each edge \(X - Y\), search for a separating set \(S\) such that \(X \perp\!\!\!\perp Y \mid S\). If one exists, delete the edge and record \(S\) as the separating set. Increase \(|S|\) from \(0, 1, 2, \dots\) until no edges remain to test.

Phase 2 — V-structures

For each unshielded triple \(X - Z - Y\) (i.e., \(X\) and \(Y\) are not adjacent), check the recorded separating set: if \(Z \notin S\), orient as \(X \to Z \leftarrow Y\) (a collider).

Phase 3 — Meek’s rules

Propagate orientations using four logical rules (R1–R4): never create a new v-structure or a directed cycle. Anything left undirected is genuinely ambiguous under the data alone.

Output: a CPDAG representing the Markov equivalence class.

Toy run: 5-node example with one isolated node

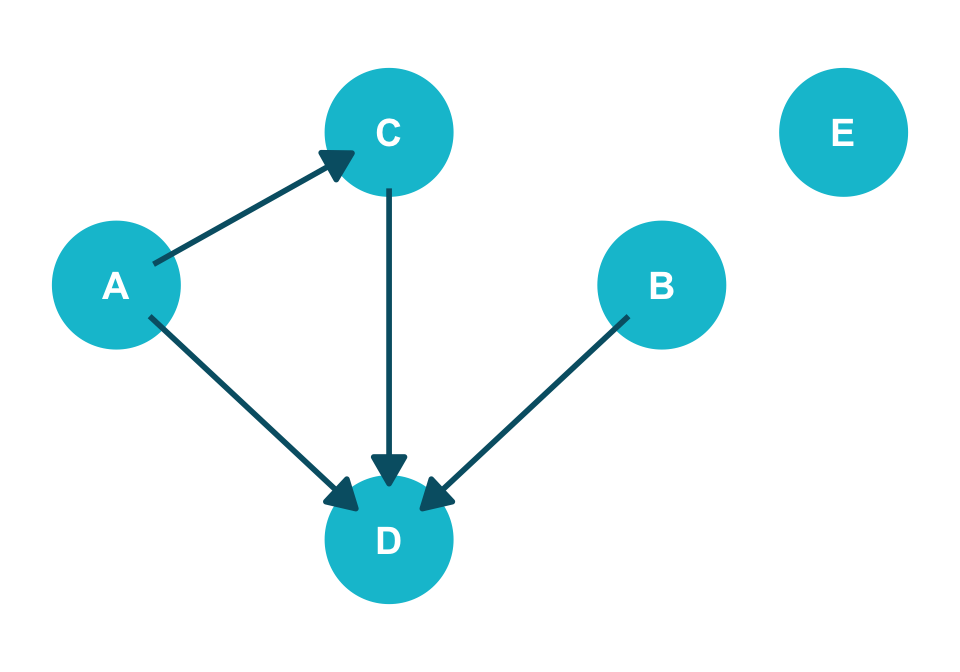
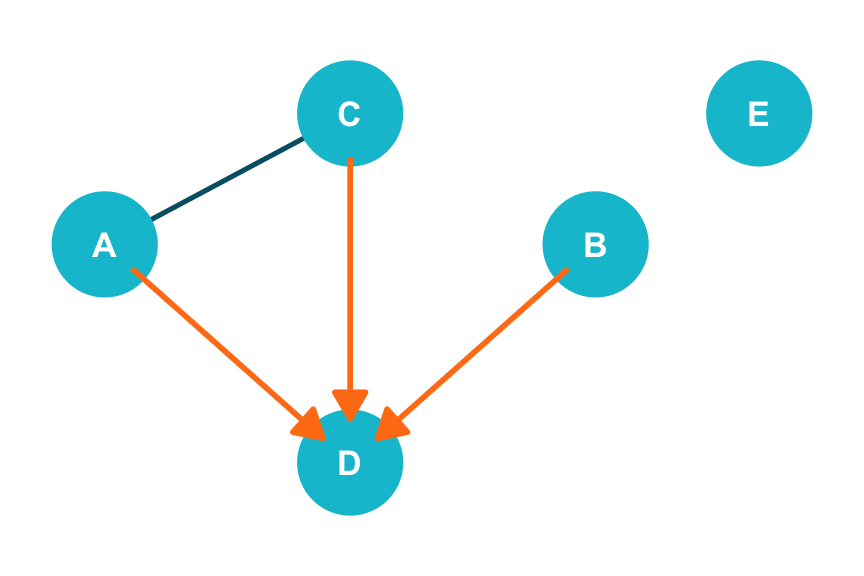
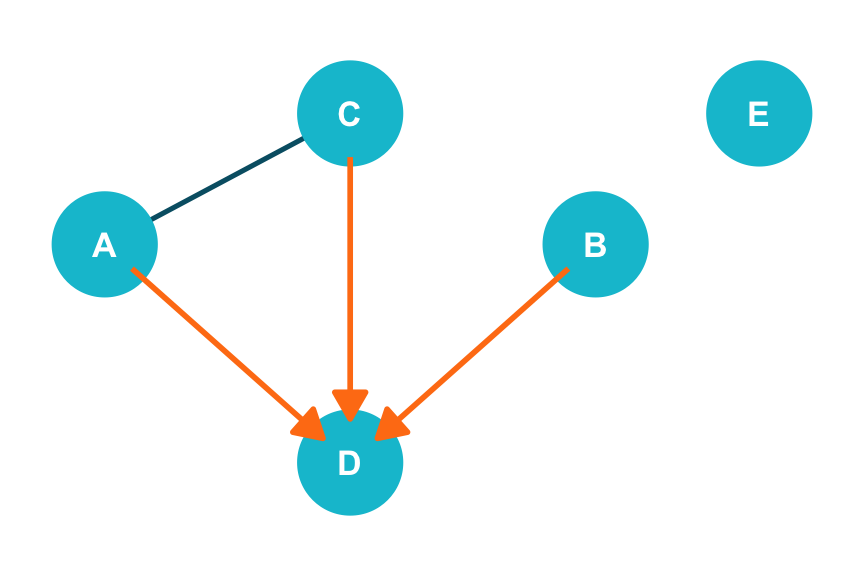
Ground truth: \(A \to C\), \(A \to D\), \(B \to D\), \(C \to D\). \(D\) is a 3-parent collider; \(E\) is isolated.

Conditional independencies implied by the DAG:

From d-separation

  • \(E \perp\!\!\!\perp \{A, B, C, D\}\) marginally — no edges
  • \(A \perp\!\!\!\perp B\) marginally — only paths via collider \(D\)
  • \(B \perp\!\!\!\perp C\) marginally — only path \(B \to D \leftarrow C\) blocked
  • \(A \not\perp\!\!\!\perp B \mid D\) — conditioning on collider opens path
  • \(A\) and \(C\): directly adjacent, never independent

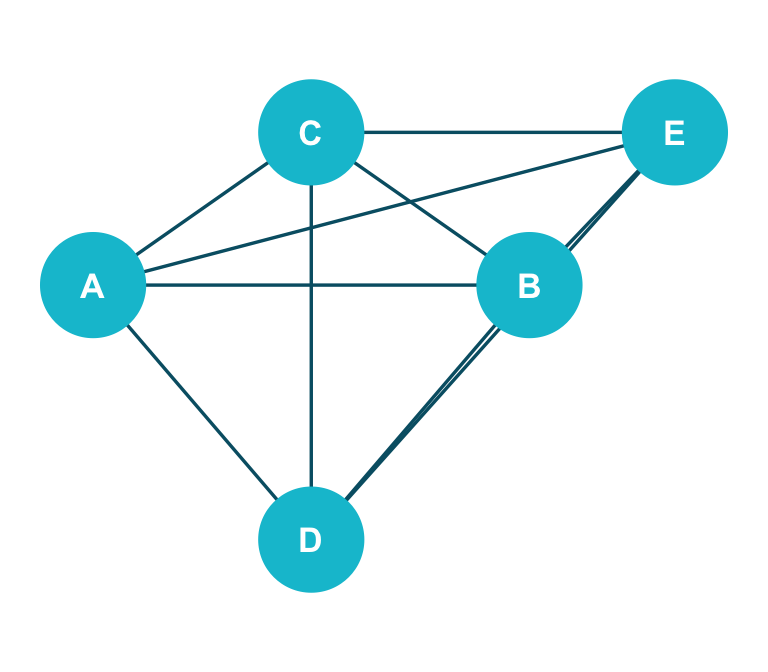
Goal of PC: start from \(K_5\) (10 edges), use these CIs (read from data) to recover the CPDAG. Then check: how close to ground truth?

PC step 1: skeleton phase removes edges by CI tests

Start: complete \(K_5\) (10 edges)

\(\Rightarrow\)

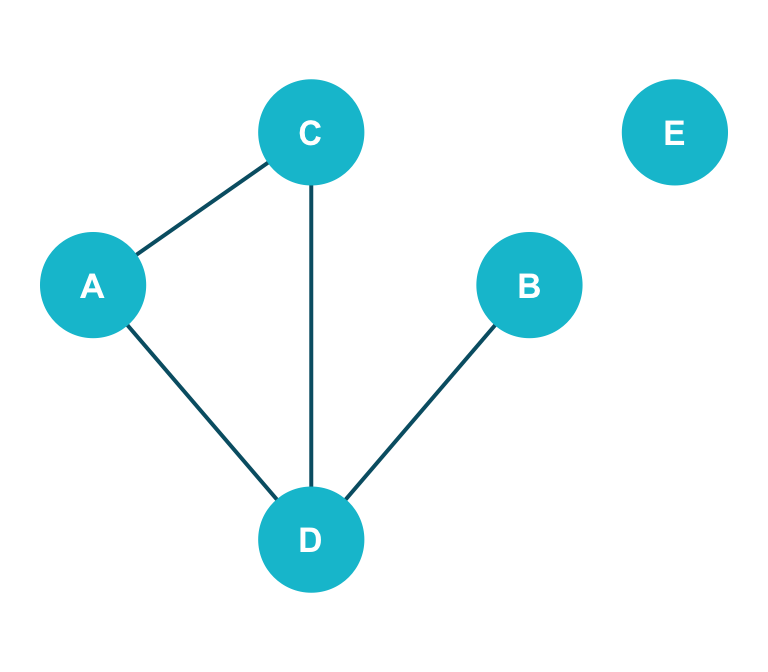
\(|S| = 0\): drop 6 edges (4 to \(E\) + \(A\!-\!B\) + \(B\!-\!C\))

Final skeleton (4 edges)

All separating sets are \(\varnothing\). \(|S|\!=\!1, 2\) remove no further edges.

PC step 2: orient v-structures from separating sets

Test every unshielded triple \(X - Z - Y\) (\(X, Y\) not adjacent):

Rule

If \(Z \notin \text{sep}(X, Y)\), orient \(X \to Z \leftarrow Y\) (collider). Else, leave undirected.

Apply to our triples

Skeleton has two unshielded triples sharing \(D\):

  • Pair \(\{A, B\}\), neighbor \(D\): \(D \notin \text{sep}(A, B) = \varnothing\) → collider! Orient \(A \to D \leftarrow B\).
  • Pair \(\{B, C\}\), neighbor \(D\): \(D \notin \text{sep}(B, C) = \varnothing\) → collider! Orient \(B \to D \leftarrow C\).
  • Pair \(\{A, B\}\), neighbor \(C\): \(C\) is not adjacent to \(B\) — not a triple.

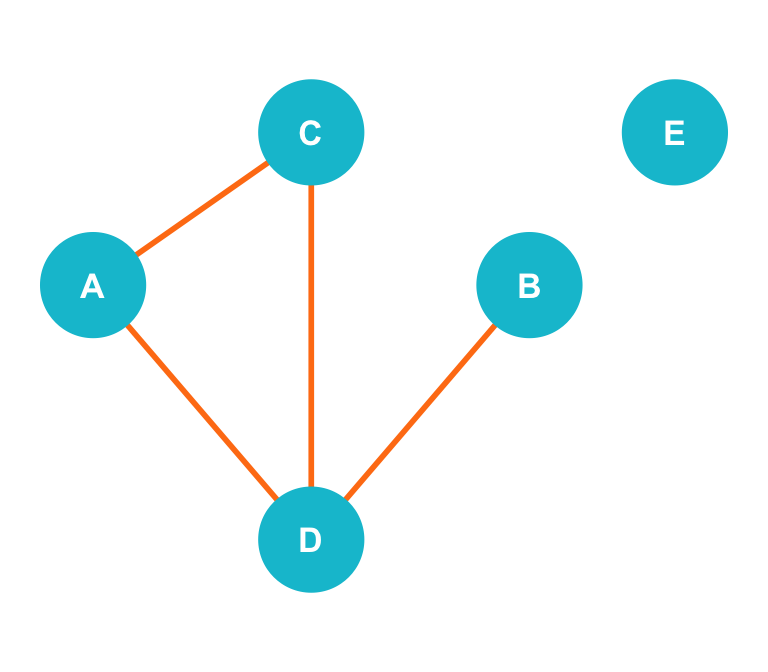
Three arrows oriented at the collider \(D\) — \(A \to D\), \(B \to D\), \(C \to D\).

(Edge \(A - C\) remains undirected — no v-structure involves it.)

PC step 3: Meek’s rules propagate orientations

Four rules, applied iteratively:

R1: avoid new v-structures

If \(X \to Z - Y\) and \(X, Y\) not adjacent, then orient \(Z \to Y\) (otherwise \(X \to Z \leftarrow Y\) would be a v-structure we did not detect).

R2: avoid cycles

If \(X \to Z \to Y\) and \(X - Y\), then orient \(X \to Y\).

R3, R4 (continued)

R3 and R4 handle further propagation cases, all rooted in the same two principles: no new v-structures, no directed cycles.

In our toy DAG: v-structures already pinned \(A \to D\), \(B \to D\), \(C \to D\). R1 needs an outgoing oriented edge feeding an undirected neighbor — but every oriented arrow points into \(D\), which has no undirected edges leaving it. \(A - C\) stays undirected.

PC’s output: CPDAG

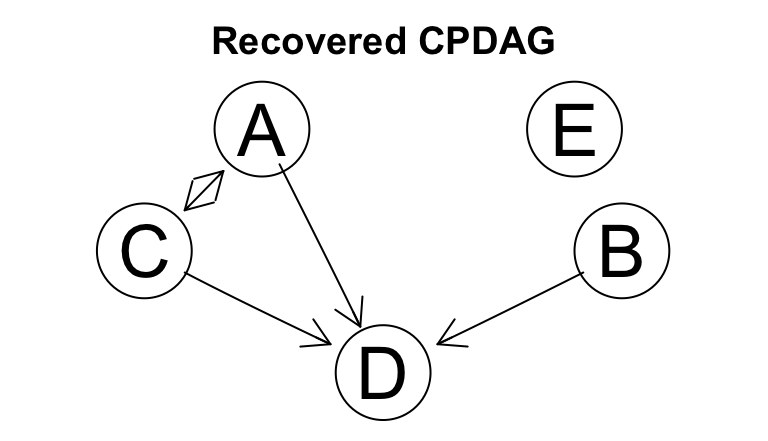
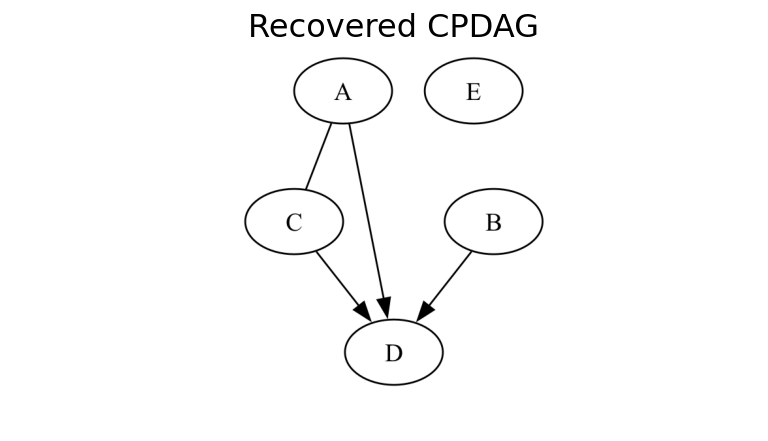
Ground-truth DAG: \(A \to C\), \(A \to D\), \(B \to D\), \(C \to D\). PC recovered the skeleton, the collider \(D\) (3 oriented arrows), and isolated \(E\). \(A - C\) stays undirected — equivalence-class undetermined.

PC’s assumptions and how they fail

Assumption What it buys us How it fails Symptom
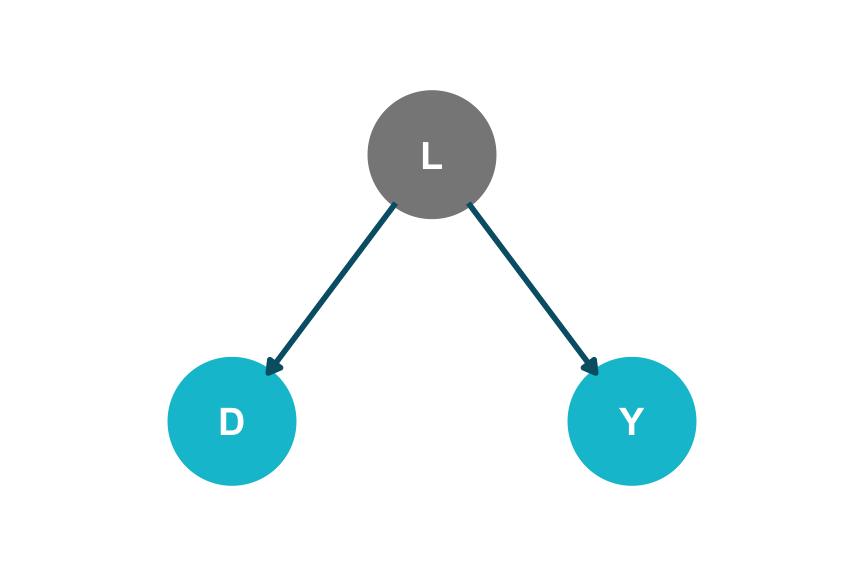
Causal sufficiency No latent confounders — every common cause is observed. Hidden variable \(L\) confounds \(D, Y\). Spurious direct edge \(D - Y\) that should be a fork.
Faithfulness Every CI in the data corresponds to a d-separation in the DAG. Two paths exactly cancel (positive direct + negative indirect). Edge wrongly removed → wrong skeleton.
Correct CI test Test detects the right CIs at finite sample size. Wrong family (Gaussian test on non-linear data); too small \(n\). Random edges added or removed; output unstable.
No selection bias Sample is not implicitly conditioned on a collider. Survivor data; cohort filtering on outcome. Spurious dependencies between independent causes.

Causal sufficiency is the heaviest. We address it next with FCI.

What if causal sufficiency fails? FCI extends PC

Setup. A latent \(L\) confounds \(D\) and \(Y\); \(L\) is unobserved.

PC sees only \(D\) and \(Y\). They are dependent (because of \(L\)), so PC connects them with a direct edge \(D - Y\). Wrong: there is no direct effect.

FCI (Spirtes, Meek, and Richardson 1995) outputs a PAG (Partial Ancestral Graph) with richer edge marks:

PAG edge marks

  • \(D \to Y\): \(D\) causes \(Y\) (direct or via observed mediators).
  • \(D \leftrightarrow Y\): \(D\) and \(Y\) share an unmeasured common cause.
  • \(D \;\circ\!\!\to\; Y\): \(Y\) is not a cause of \(D\), but the rest is unidentified.
  • \(D \;\circ\!\!-\!\!\circ\; Y\): orientation completely unidentified.

In our setup FCI returns \(D \leftrightarrow Y\) — the bidirected mark flags the latent confounder instead of mistaking it for a direct edge.

FCI’s price: a richer output that is harder to read, more CI tests, and more orientation rules.

GES: search the space of DAGs by score

GES (Chickering 2002) takes a different route to the same destination. Instead of asking “which CIs hold?”, it asks “which DAG scores best?” — and walks through DAG space greedily.

Score function (BIC for Gaussian data):

\[\text{BIC}(G; \text{data}) = -2 \log L(G) + k(G) \log n\]

  • \(\log L(G)\): log-likelihood of the data given graph \(G\).
  • \(k(G)\): number of parameters (edges + variances).
  • \(\log n\): complexity penalty — punishes overly dense graphs.

Two-phase greedy search:

Forward phase

Start from the empty graph. At each step, add the single edge that improves BIC the most. Stop when no edge addition improves the score.

Backward phase

From the forward-phase output, remove the single edge that improves BIC the most. Stop when no removal improves the score.

Output: a CPDAG — same equivalence-class limit as PC, by a different route.

GES vs. PC: same destination, different vehicle

Property PC (constraint) GES (score)
Asymptotic limit CPDAG (Markov equivalence class) CPDAG (same)
Per-step decision Many local CI tests (each edge has its own test). One global score, evaluated under each candidate edit.
Small-sample stability Sensitive: a single noisy CI test propagates into wrong skeleton. More stable: BIC integrates over all data at once.
High-dim scaling Better: tests are fast; can prune many edges quickly. Worse: each candidate evaluation requires a likelihood fit.
What can go wrong Faithfulness violations; bad CI test family. Wrong likelihood model (e.g., Gaussian on heavy tails).

In practice: run both when sample size permits, and check whether they agree. Disagreement is informative.

LiNGAM: non-Gaussian noise breaks the equivalence class

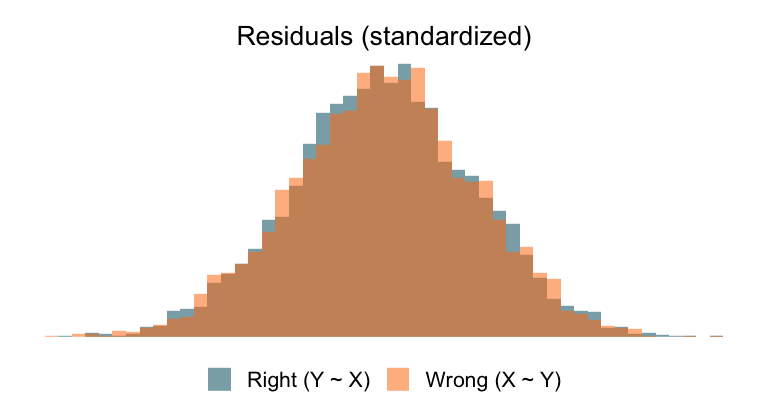
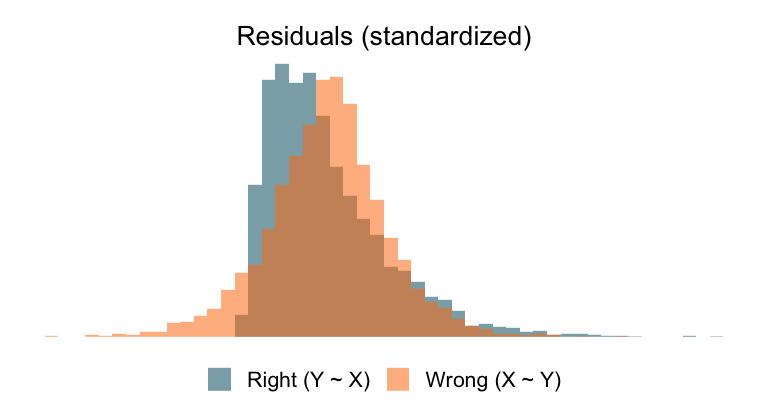
True model \(Y = \beta X + \varepsilon_Y\), \(\varepsilon_Y \perp X\). Right \(Y \sim X\): residuals \(\hat\varepsilon \approx \varepsilon_Y\) (= noise). Wrong \(X \sim Y\): residuals \(\hat\varepsilon^* = X - \hat\gamma Y\) keep a remnant of \(X\) — OLS only forces them uncorrelated with \(Y\), not independent.

Gaussian noise — residual shapes match

Both bells coincide. The remnant is there algebraically, but Gaussians are closed under linear combinations — every shape statistic looks identical. Direction unidentifiable.

Non-Gaussian noise (gamma) — shapes diverge

Right residuals = the skewed noise. Wrong residuals \(\propto X - \varepsilon_Y\) are symmetric (two skews with opposite signs cancel asymmetry). Direction identifiable.

LiNGAM (via ICA) listens for the gap between right- and wrong-direction residuals. Gaussianity hides it; non-Gaussianity exposes it. (Shimizu et al. 2006)

How LiNGAM works: ICA on the residuals

The model assumption: \(\mathbf{x} = B\mathbf{x} + \mathbf{e}\), where \(B\) is a strictly lower-triangular matrix (after permutation) and the noise \(\mathbf{e}\) has independent, non-Gaussian components.

Step 1 — Solve for the noise

Rearrange: \(\mathbf{e} = (I - B)\mathbf{x} = A\mathbf{x}\). The matrix \(A\) “un-mixes” the variables back into independent noise sources.

Step 2 — ICA

Independent Component Analysis recovers the un-mixing matrix \(A\) (up to permutation and scaling) by maximizing non-Gaussianity of the recovered components. This is the step that fails for Gaussian noise — Gaussians are rotationally symmetric, so ICA cannot pin down rotation.

Step 3 — Permute and scale

Permute the rows of \(A\) to make the diagonal as close to 1 as possible. The permutation that succeeds gives the causal ordering: variables earlier in the ordering cause variables later. Read off \(B = I - A\) to get edge weights.

Output: a unique DAG with estimated edge weights — assuming linearity and at most one Gaussian noise component hold.

Hands-on: discover a DAG from simulated data

Same 5-node toy from the walkthrough — ground truth \(A \to C\), \(A \to D\), \(B \to D\), \(C \to D\), with \(E\) isolated. Simulate \(n = 500\), run PC, and read the recovered CPDAG.

Show code: PC discovery in R
suppressPackageStartupMessages({
  library(pcalg)
  library(Rgraphviz)
})

set.seed(1); n <- 500
A <- rnorm(n); B <- rnorm(n); E <- rnorm(n)
C <- 0.7 * A + rnorm(n)
D <- 0.6 * A + 0.6 * B + 0.5 * C + rnorm(n)

dat <- data.frame(A = A, B = B, C = C, D = D, E = E)

fit <- pc(suffStat = list(C = cor(dat), n = nrow(dat)),
          indepTest = gaussCItest,
          alpha = 0.05,
          labels = colnames(dat))

plot(fit, main = "Recovered CPDAG")

Show code: PC discovery in Python
import io
import numpy as np
import matplotlib.pyplot as plt
from PIL import Image
from causallearn.search.ConstraintBased.PC import pc
from causallearn.utils.GraphUtils import GraphUtils

np.random.seed(1); n = 500
A = np.random.randn(n); B = np.random.randn(n); E = np.random.randn(n)
C = 0.7 * A + np.random.randn(n)
D = 0.6 * A + 0.6 * B + 0.5 * C + np.random.randn(n)

data = np.column_stack([A, B, C, D, E])

cg = pc(data, alpha=0.05, indep_test='fisherz', show_progress=False)

pyd = GraphUtils.to_pydot(cg.G, labels=['A', 'B', 'C', 'D', 'E'])
img = Image.open(io.BytesIO(pyd.create_png()))
fig, ax = plt.subplots(figsize=(4, 2.3))
_ = ax.imshow(img)
_ = ax.set_title('Recovered CPDAG')
ax.set_axis_off()

Hands-on: same data, three algorithms

Gaussian noise

Algorithm Skeleton Orientations Output type
PC 4 edges + \(E\) isolated collider at \(D\): \(A, B, C \to D\); \(A - C\) CPDAG
GES 4 edges + \(E\) isolated collider at \(D\): \(A, B, C \to D\); \(A - C\) CPDAG
LiNGAM 4 edges + \(E\) isolated all 4 oriented, but with non-trivial error rate unique DAG
Show code
# --- Simulate 5-node SEM with non-Gaussian noise ---------------
set.seed(1); n <- 1000
g <- function() rgamma(n, shape = 2, rate = 1) - 2   # mean-0, skewed
# (swap g() -> rnorm(n) for the Gaussian-noise variant)

A <- g(); B <- g(); E <- g()                  # roots; E is an isolated decoy
C <- 0.7 * A + g()
D <- 0.6 * A + 0.6 * B + 0.5 * C + g()        # 3-parent collider
dat <- data.frame(A = A, B = B, C = C, D = D, E = E)

# --- Fit three algorithms --------------------------------------
library(pcalg)

fit_pc  <- pc(suffStat = list(C = cor(dat), n = nrow(dat)),
              indepTest = gaussCItest, alpha = 0.05,
              labels = colnames(dat))

score   <- new("GaussL0penObsScore", as.matrix(dat))
fit_ges <- ges(score)

fit_lin <- lingam(as.matrix(dat))   # only identifies under non-Gaussian noise
Show code
# --- Simulate 5-node SEM with non-Gaussian noise ---------------
import numpy as np
rng = np.random.default_rng(1); n = 1000
g = lambda: rng.gamma(shape=2, scale=1, size=n) - 2   # mean-0, skewed
# (swap g() -> rng.standard_normal(n) for the Gaussian-noise variant)

A = g(); B = g(); E = g()                  # roots; E is an isolated decoy
C = 0.7 * A + g()
D = 0.6 * A + 0.6 * B + 0.5 * C + g()      # 3-parent collider
dat = np.column_stack([A, B, C, D, E])

# --- Fit three algorithms --------------------------------------
from causallearn.search.ConstraintBased.PC import pc
from causallearn.search.ScoreBased.GES.GES import ges
from causallearn.search.FCMBased.lingam import ICALiNGAM

fit_pc  = pc(dat, alpha=0.05, indep_test='fisherz', show_progress=False)
fit_ges = ges(dat)
fit_lin = ICALiNGAM().fit(dat)      # only identifies under non-Gaussian noise

Non-Gaussian noise (gamma residuals)

Algorithm Skeleton Orientations Output type
PC 4 edges + \(E\) isolated collider at \(D\) (same); \(A - C\) CPDAG
GES 4 edges + \(E\) isolated collider at \(D\) (same); \(A - C\) CPDAG
LiNGAM 4 edges + \(E\) isolated all 4 correctly oriented: \(A \to C\), \(A, B, C \to D\) unique DAG

Reading the experiment. PC and GES are blind to the distributional change — they identify the MEC either way. LiNGAM’s identifiability advantage only materializes when the assumption it relies on (non-Gaussian noise) is satisfied.

Pick the algorithm whose assumptions match your data, not the one with the strongest output guarantee.

Sensitivity: discovery output is unstable across hyperparameters

Same data, three values of \(\alpha\) (CI-test significance level for PC):

\(\alpha\) Edges V-structures Notes
0.01 (strict) 3 1 More edges removed; risk of missing real edges.
0.05 (default) 4 1 Matches ground truth’s adjacency.
0.10 (lenient) 4–5 1–2 Risk of spurious edges; possibly extra v-structures.

Why this matters. The CI test’s significance level is a modeling choice with no principled default. Different \(\alpha\) values produce different CPDAGs on the same data.

Always report sensitivity

  1. Run PC at multiple \(\alpha\) values; report intersection (high-confidence) + union (uncertain).
  2. For GES: rerun with different score functions (BIC, BDe) and compare.

What discovery does (and doesn’t) deliver

Best case (correct assumptions, large n)

  • Constraint/score methods → the CPDAG of the data-generating distribution.
  • LiNGAM (linearity + non-Gaussian noise) → a unique DAG with edge weights.

Common case — output is sensitive

  • Choice of CI test (PC) or score function (GES).
  • Significance level \(\alpha\) or BIC penalty weight; sample size \(n\).
  • Variable preprocessing (transformations, discretization).

Worst case — silent failure when assumptions are violated

  • Causal sufficiency fails → spurious direct edges (use FCI instead).
  • Faithfulness fails → real edges removed.
  • Nonlinearity violated → wrong CIs detected; selection bias → spurious edges.

The algorithms do not warn you. A wrong output looks as confident as a correct one.

Discovery as hypothesis generator, not oracle

The right way to position causal discovery in the analyst’s workflow:

Wrong framing

“Run the algorithm, get the DAG, plug it into do-calculus, done.”

A discovery output is not a substitute for substantive understanding. Treating it as one shifts modeling responsibility onto an algorithm that cannot answer for it.

Right framing

“Discovery proposes; expertise edits; experiments confirm.”

Discovery generates candidate structures from observational data. Domain knowledge prunes nonsensical edges, adds known constraints (background knowledge), and identifies edges that need experimental confirmation.

The DAG that ends up in your identification analysis is a synthesis of three sources, not the output of any one of them.

From observational data to causal claims:

discovery  ⟶  DAG hypothesis  ⟶  identification  ⟶  estimation

References

Bareinboim, Elias, Juan D. Correa, Duligur Ibeling, and Thomas Icard. 2022. “On Pearl’s Hierarchy and the Foundations of Causal Inference.” Probabilistic and Causal Inference: The Works of Judea Pearl, 507–56. https://doi.org/10.1145/3501714.3501743.
Chickering, David Maxwell. 2002. “Optimal Structure Identification with Greedy Search.” Journal of Machine Learning Research 3: 507–54.
Hünermund, Paul, and Elias Bareinboim. 2023. “Causal Inference and Data Fusion in Econometrics.” The Econometrics Journal 26 (1): 1–34. https://doi.org/10.1093/ectj/utad008.
Pearl, Judea. 2009. Causality: Models, Reasoning, and Inference. 2nd ed. Cambridge University Press. https://doi.org/10.1017/CBO9780511803161.
Shimizu, Shohei, Patrik O. Hoyer, Aapo Hyvärinen, and Antti Kerminen. 2006. “A Linear Non-Gaussian Acyclic Model for Causal Discovery.” Journal of Machine Learning Research 7: 2003–30.
Shpitser, Ilya, and Judea Pearl. 2006. “Identification of Joint Interventional Distributions in Recursive Semi-Markovian Causal Models.” Proceedings of the 21st National Conference on Artificial Intelligence (AAAI), 1219–26.
Spirtes, Peter, Clark Glymour, and Richard Scheines. 2000. Causation, Prediction, and Search. 2nd ed. Cambridge, MA: MIT Press.
Spirtes, Peter, Christopher Meek, and Thomas Richardson. 1995. “Causal Inference in the Presence of Latent Variables and Selection Bias.” Proceedings of the 11th Conference on Uncertainty in Artificial Intelligence (UAI), 499–506.
Thank you for your attention!