2. Graphical Causal Models

Causal Data Science for Business Analytics

Christoph Ihl

Hamburg University of Technology

Monday, 27. April 2026

From Assumptions to Graphs

The adjustment formula works — if you pick the right conditioning set

Recall the adjustment formula from Session 01:

\[\tau = \mathbb{E}_X\!\Big[\mathbb{E}[Y \mid D=1, X] - \mathbb{E}[Y \mid D=0, X]\Big]\]

Required assumptions:

  1. Conditional exchangeability / unconfoundedness: \((Y(1), Y(0)) \perp\!\!\!\perp D \mid X\)
  2. Positivity: \(0 < P(D=1 \mid X=x) < 1\)
  3. Consistency: \(D_i = d \Rightarrow Y_i = Y_i(d)\)
  4. No interference: \(Y_i(d_1, \ldots, d_n) = Y_i(d_i)\)

The formula works — if we pick the right \(X\). But how?

Which X?

  • Include too few variables \(\rightarrow\) bias remains
  • Include too many variables \(\rightarrow\) new bias introduced
  • Include the wrong variables \(\rightarrow\) estimate gets worse, not better

This session introduces Directed Acyclic Graphs (DAGs) — a tool that answers this question systematically.

DAGs encode your assumptions about the data-generating process

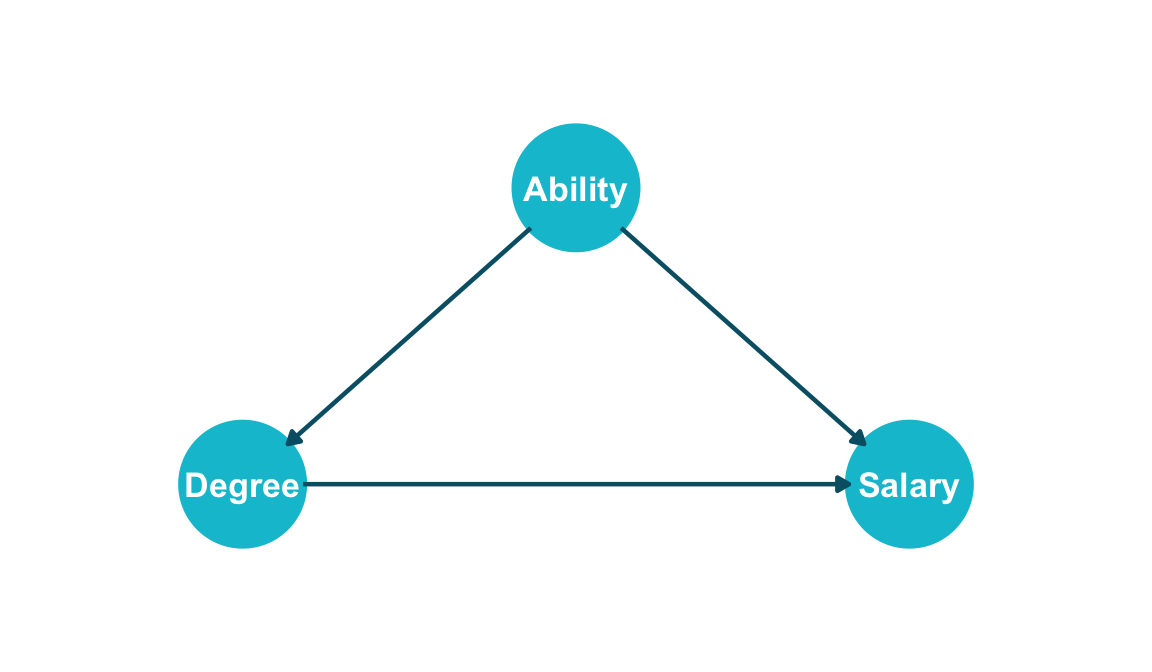
A Directed Acyclic Graph (DAG) consists of:

  • Nodes = random variables
  • Directed edges (arrows) = direct causal effects
  • Acyclic = no feedback loops (no variable causes itself)


A DAG represents your qualitative causal assumptions about the data-generating process (Pearl 2009; Elwert 2013). It is not learned from data (that is Session 03) — it comes from domain knowledge.

Show code
library(ggdag)
library(ggplot2)

coord_dag <- list(
  x = c(Degree = 0, Ability = 0.5, Salary = 1),
  y = c(Degree = 0, Ability = 0.5, Salary = 0)
)

dag <- dagify(Degree ~ Ability,
              Salary ~ Degree,
              Salary ~ Ability,
              coords = coord_dag)

dag |>
  ggplot(aes(x = x, y = y, xend = xend, yend = yend)) +
  geom_dag_point(colour = "#00C1D4", size = 22) +
  geom_dag_edges(edge_colour = "#005e73", edge_width = 0.8) +
  geom_dag_text(colour = "white", size = 4.5, fontface = "bold") +
  expand_limits(x = c(-0.2, 1.2), y = c(-0.2, 0.7)) +
  coord_cartesian(clip = "off") +
  theme_dag(legend.position = "none")

A DAG is a non-parametric claim about independence structure

A DAG encodes three interconnected assumptions about the joint distribution:

Local Markov Assumption

Given its parents, each node is independent of all its non-descendants: \(X_i \perp\!\!\!\perp \text{NonDesc}(X_i) \mid \text{Pa}(X_i)\)

Minimality Assumption (Faithfulness)

Every edge in the DAG corresponds to a real dependence. Adjacent nodes are not independent given any subset of other nodes. No edges are superfluous — if you can remove an edge without violating any conditional independence, the DAG is wrong.

Causal Edge Assumption

Directed edges represent direct causal effects, not mere statistical associations. An outcome \(Y\) “listens to” its parents: \(Y\) changes in response to changes in its causes (Pearl 2009). This is what turns a Bayesian network into a causal model.

The first two assumptions imply the Bayesian network factorization (next slide); the third makes it causal.

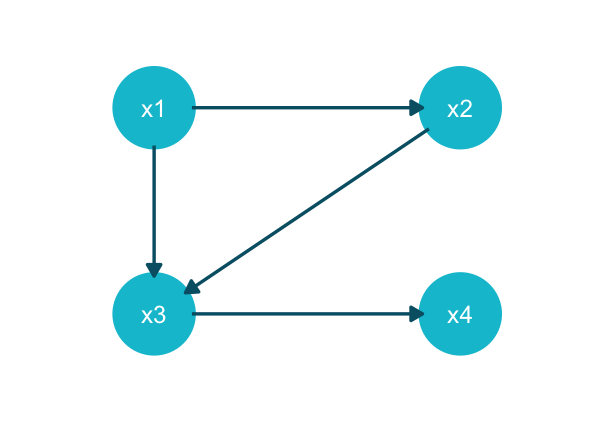
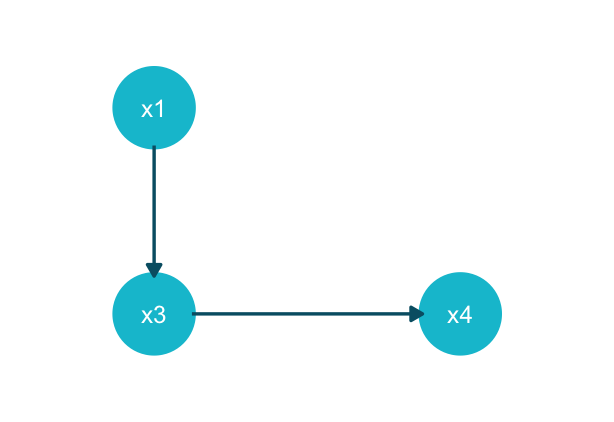
Bayesian network factorization turns an exponential joint into local pieces

By the chain rule of probability, any joint distribution factorizes as \[P(x_1, x_2, \ldots, x_n) = P(x_1) \prod_{i=2}^{n} P(x_i \mid x_{i-1}, \ldots, x_1)\]

For \(n = 4\) binary variables, the last term \(P(x_4 \mid x_3, x_2, x_1)\) alone requires \(2^{4-1} = 8\) parameters. A DAG exploits local dependencies via the Local Markov Assumption — we only condition on each node’s parents:

\(P_{\text{joint}} = P(x_1)\,P(x_2 \mid x_1)\,P(x_3 \mid x_2, x_1)\,P(x_4 \mid x_3)\)

\(P_{\text{joint}} = P(x_1)\,P(x_2)\,P(x_3 \mid x_1)\,P(x_4 \mid x_3)\)

DAGs generate testable predictions

A DAG doesn’t just encode assumptions — it makes those assumptions falsifiable. Each DAG implies a full list of conditional independencies: every triple \((X, Y, Z)\) for which the graph claims \(X \perp\!\!\!\perp Y \mid Z\).

If data violates any of these, the DAG is likely misspecified.

The next two sections give us the machinery — building blocks (chain / fork / collider) and d-separation — to read these predictions off any DAG. The R/Python output on the right is a teaser of what we will then be able to compute and test.

Session 03 preview: Causal discovery algorithms reverse this logic — they test conditional independencies in data to learn the DAG.

Implied conditional independencies:

Show code
library(dagitty)

dag <- dagitty("dag{
  Z1 -> D
  Z2 -> D
  Z2 -> Z3
  D -> M -> Y
  Z3 -> Y
  D -> Z4
  Y -> Z4
}")

print(impliedConditionalIndependencies(dag))
D _||_ Y | M, Z3
D _||_ Y | M, Z2
D _||_ Z3 | Z2
M _||_ Z1 | D
M _||_ Z2 | D
M _||_ Z3 | Z2
M _||_ Z3 | D
M _||_ Z4 | D, Y
Y _||_ Z1 | D, Z2
Y _||_ Z1 | D, Z3
Y _||_ Z1 | M, Z2
Y _||_ Z1 | M, Z3
Y _||_ Z2 | D, Z3
Y _||_ Z2 | M, Z3
Z1 _||_ Z2
Z1 _||_ Z3
Z1 _||_ Z4 | D, Y
Z1 _||_ Z4 | D, Z3
Z1 _||_ Z4 | D, Z2
Z2 _||_ Z4 | D, Y
Z2 _||_ Z4 | D, Z3
Z3 _||_ Z4 | D, Y
Z3 _||_ Z4 | M, Y, Z2
Show code
from pgmpy.base import DAG

dag = DAG([
    ("Z1", "D"), ("Z2", "D"), ("Z2", "Z3"),
    ("D", "M"), ("M", "Y"), ("Z3", "Y"),
    ("D", "Z4"), ("Y", "Z4")
])

print(dag.get_independencies())
(M ⟂ Z3 | D)
(Z1 ⟂ Z2)
(Y ⟂ Z1 | M, Z3)
(Z2 ⟂ Z4 | D, Y)
(Z3 ⟂ Z4 | D, Y)
(Z1 ⟂ Z4 | D, Y)
(M ⟂ Z2 | D)
(D ⟂ Y | M, Z3)
(Z1 ⟂ Z3)
(M ⟂ Z4 | D, Y)
(Y ⟂ Z2 | M, Z3)
(M ⟂ Z1 | D)
(D ⟂ Z3 | Z2)

Building Blocks of Association

Three structures govern every path in a DAG

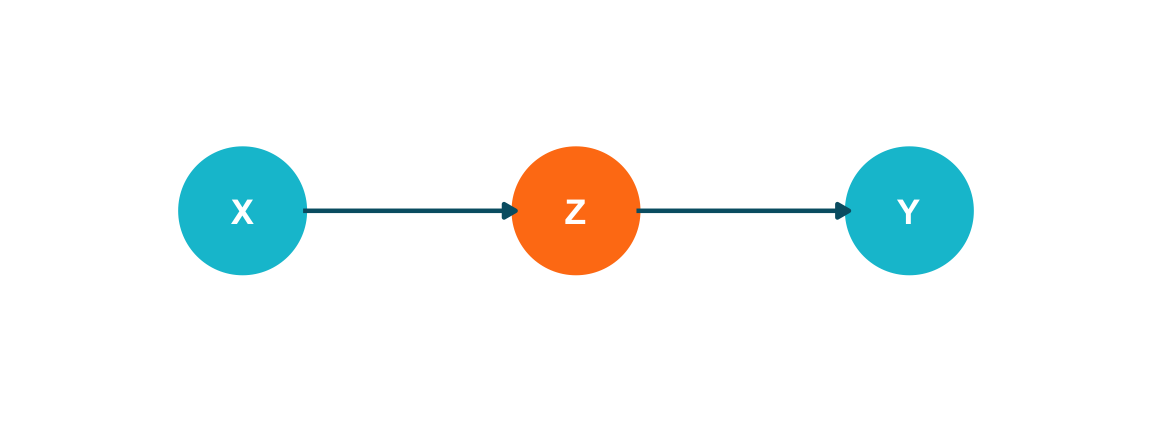
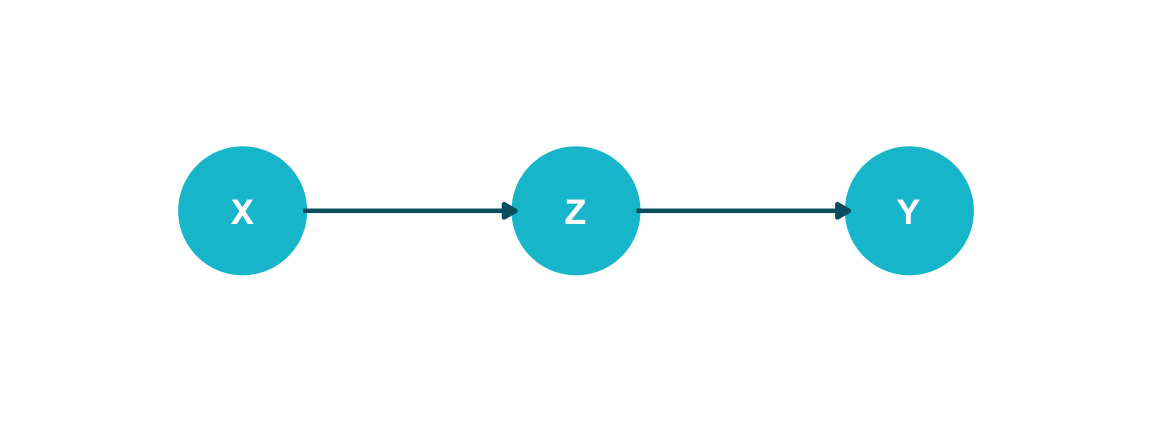
A chain transmits association from cause to effect

Chain: \(X \rightarrow Z \rightarrow Y\)


Association flows from \(X\) to \(Y\) through \(Z\). Here \(Z\) is a mediator.


Business example: R&D spending (\(X\)) \(\rightarrow\) product quality (\(Z\)) \(\rightarrow\) market share (\(Y\)).


Rule: A chain is open unconditionally. Conditioning on \(Z\) blocks the path: \[X \perp\!\!\!\perp Y \mid Z \;\Rightarrow\; P(X, Y \mid Z) = P(X \mid Z)\,P(Y \mid Z)\]

Unconditioned — path open


Conditioned on Z — path blocked

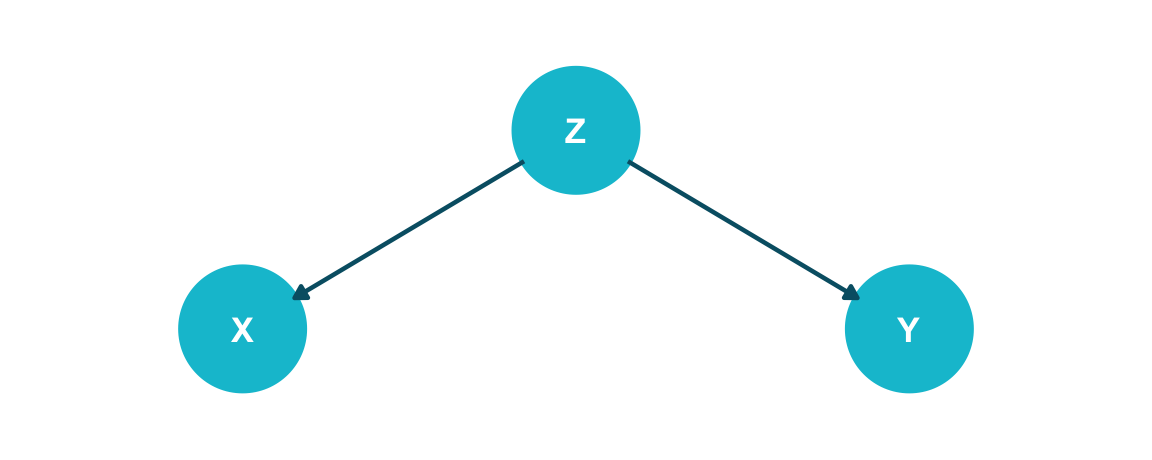
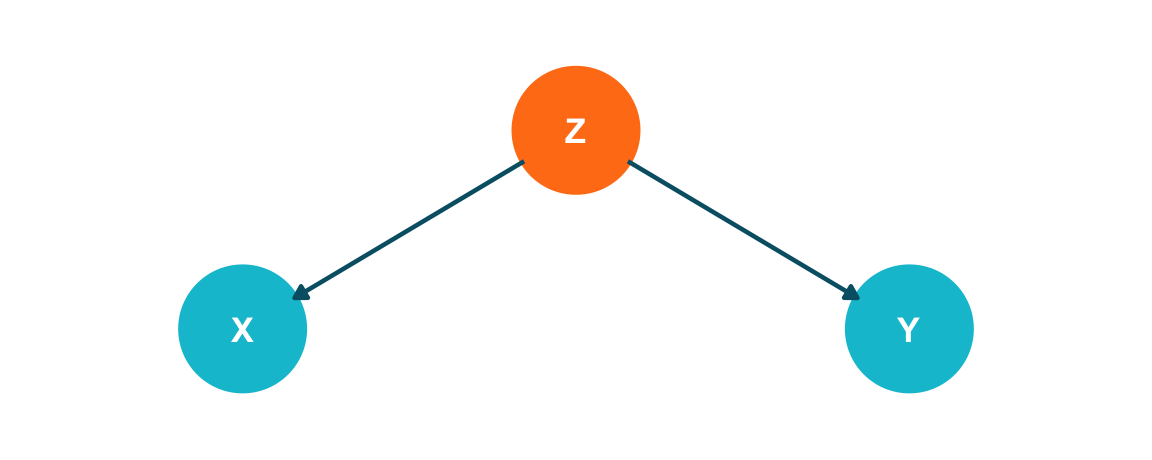
A fork creates spurious association through a common cause

Fork: \(X \leftarrow Z \rightarrow Y\)


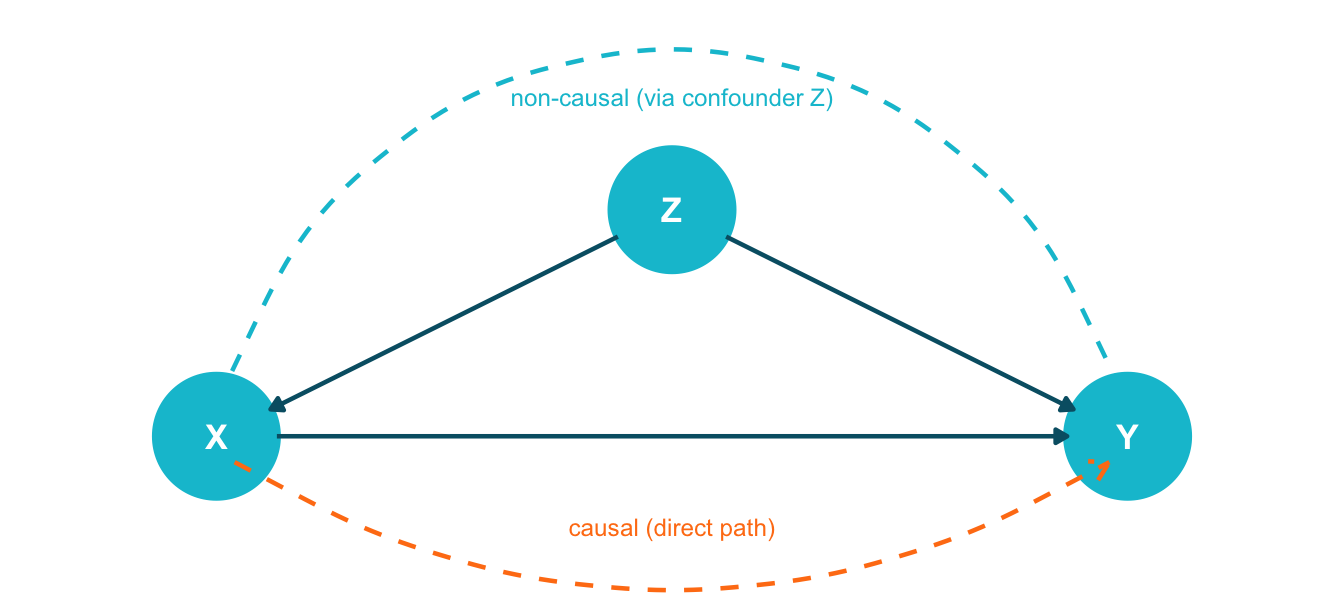
\(Z\) is a common cause — a confounder — that induces non-causal association between \(X\) & \(Y\).


Business example: Economic conditions (\(Z\)) affect both advertising spend (\(X\)) and revenue (\(Y\)). The observed correlation between ads and revenue is partly spurious.


Rule: A fork is open unconditionally. Conditioning on \(Z\) blocks the path: \[X \perp\!\!\!\perp Y \mid Z \;\Rightarrow\; P(X, Y \mid Z) = P(X \mid Z)\,P(Y \mid Z)\]

Unconditioned — path open


Conditioned on Z — path blocked

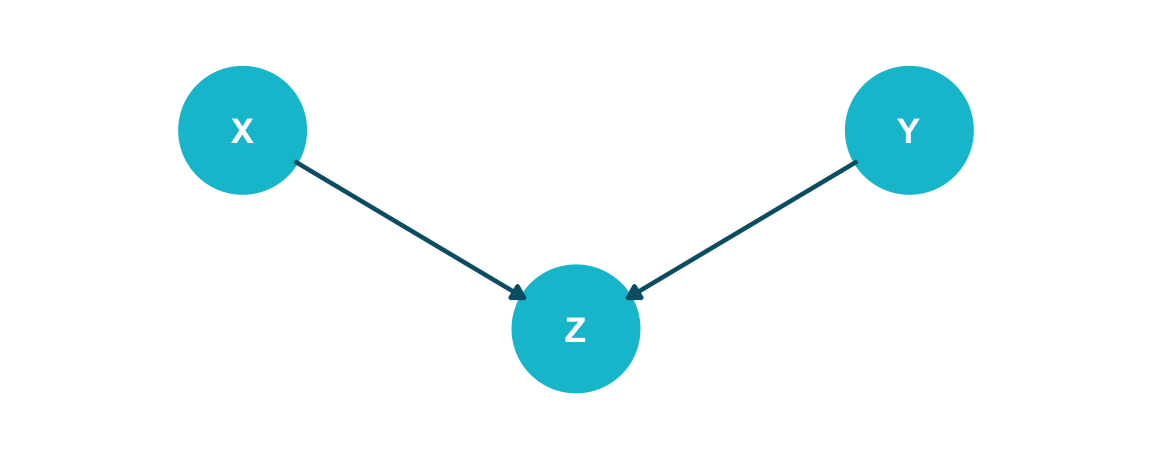
A collider blocks association — until you condition on it

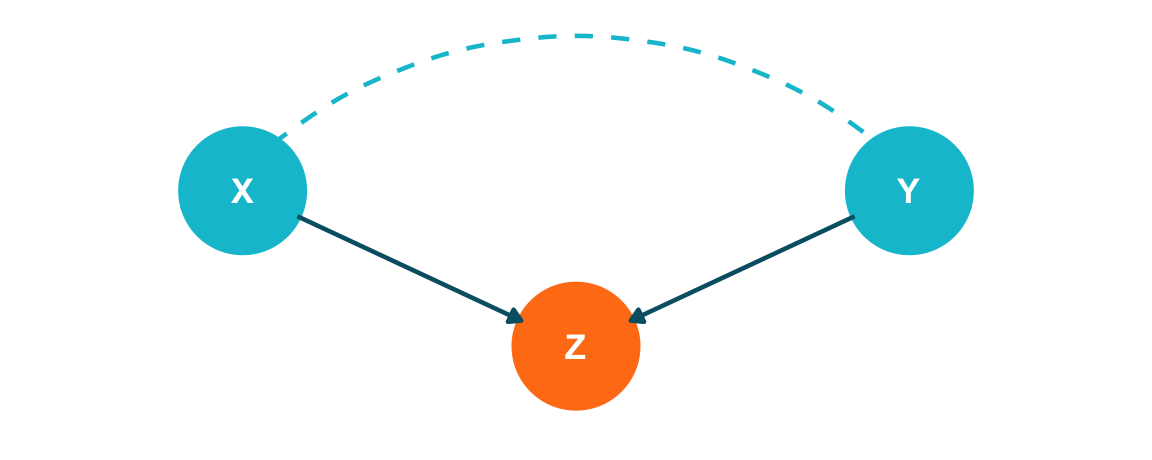
Collider (v-structure): \(X \rightarrow Z \leftarrow Y\)

Both arrows point into \(Z\), making it a collider. Unlike chains and forks, a collider blocks the path by default.

Berkson’s paradox: Looks (\(X\)) & talent (\(Y\)) are independent in the population, but both raise the chance of success (\(Z\): casting, funding, relationships). Among the successful, they appear negatively correlated.


Rule: A collider is blocked unconditionally, so \(X \perp\!\!\!\perp Y \Rightarrow P(X, Y) = P(X)\,P(Y)\). Conditioning on \(Z\) opens the path: \(X \not\perp\!\!\!\perp Y \mid Z\).

Unconditioned — path blocked


Conditioned on Z — path opens

The collider trap: why “controlling for everything” can backfire

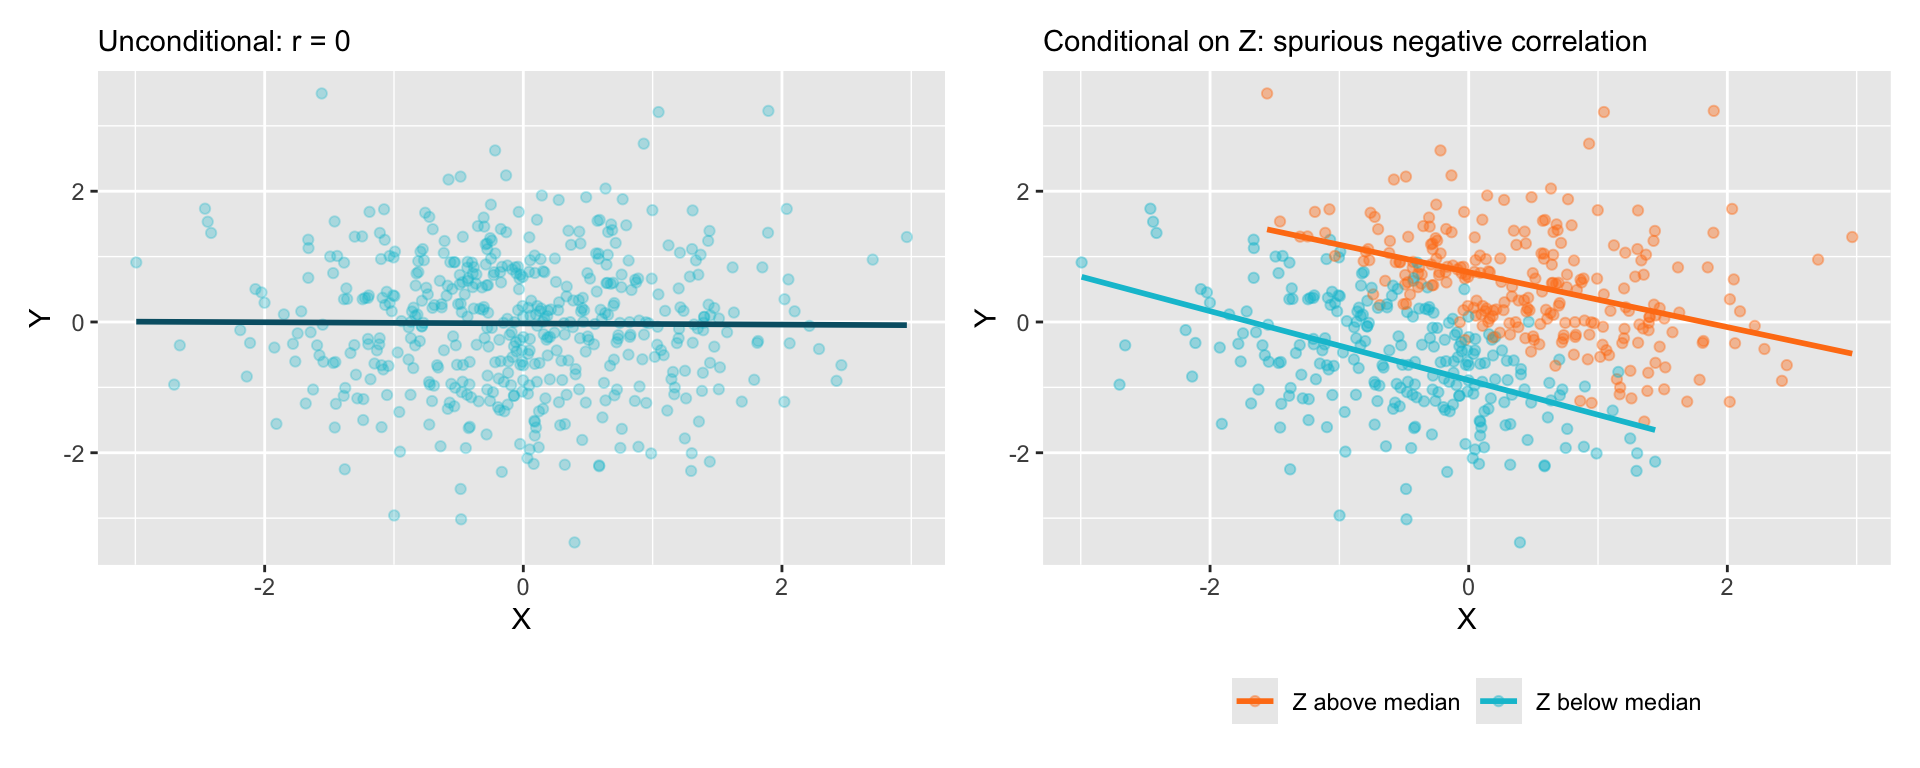
\(X\) and \(Y\) are independent causes of \(Z\). Unconditionally, \(X\) and \(Y\) are uncorrelated. But conditioning on \(Z\) (e.g., restricting to a subpopulation) creates a spurious correlation.

Show code
library(ggplot2)

set.seed(42)
n <- 500
x <- rnorm(n)
y <- rnorm(n)
z <- x + y + rnorm(n, sd = 0.3)

df <- data.frame(X = x, Y = y, Z = z,
                 group = ifelse(z > median(z), "Z above median", "Z below median"))

p1 <- ggplot(df, aes(x = X, y = Y)) +
  geom_point(alpha = 0.3, colour = "#00C1D4", size = 1.5) +
  geom_smooth(method = "lm", se = FALSE, colour = "#005e73", linewidth = 1) +
  labs(title = "Unconditional: r = 0",
       x = "X", y = "Y") +
  theme(plot.title = element_text(size = 11))

p2 <- ggplot(df, aes(x = X, y = Y, colour = group)) +
  geom_point(alpha = 0.4, size = 1.5) +
  geom_smooth(method = "lm", se = FALSE, linewidth = 1) +
  scale_colour_manual(values = c("Z above median" = "#FF7E15",
                                 "Z below median" = "#00C1D4")) +
  labs(title = "Conditional on Z: spurious negative correlation",
       x = "X", y = "Y", colour = NULL) +
  theme(plot.title = element_text(size = 11),
        legend.position = "bottom")

library(patchwork)
p1 + p2

The mantra “control for everything available” is not just wrong — it is dangerous. Including a collider as a control variable introduces bias where none existed.

Conditioning on a descendant of a collider also opens the path

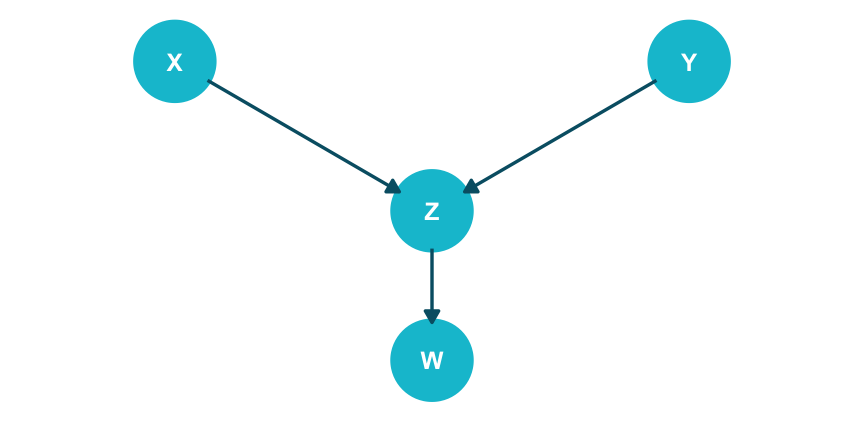
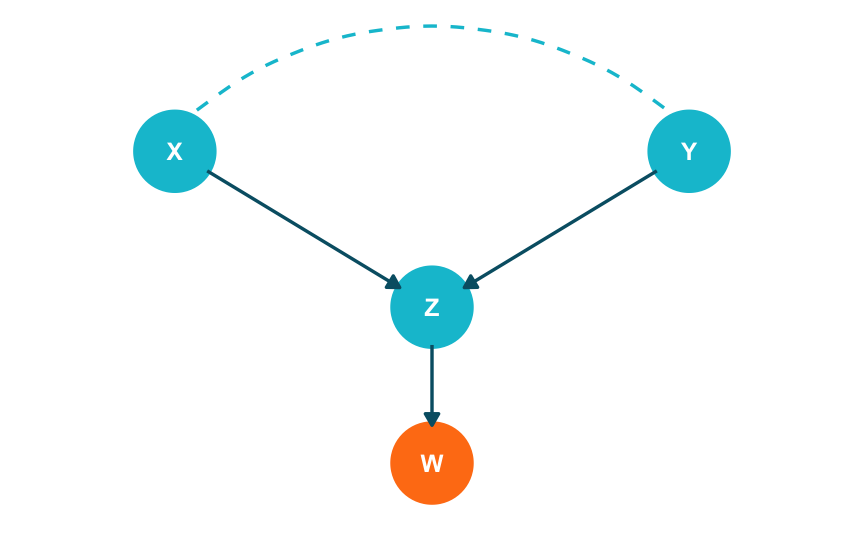
Conditioning on a descendant of a collider partially opens the collider path — information about the descendant leaks information about the collider itself.


Extended example: Programming skill (\(X\)) \(\rightarrow\) Hired (\(Z\)) \(\leftarrow\) Social skill (\(Y\)), and Hired (\(Z\)) \(\rightarrow\) Team assignment (\(W\)).


Rule: The path \(X \to Z \leftarrow Y\) is blocked when we do not condition on \(Z\) or any of its descendants. Conditioning on \(W\) (a descendant of \(Z\)) opens the path: \(X \not\perp\!\!\!\perp Y \mid W\).

Unconditioned — collider path blocked

Conditioned on descendant W — path opens

The three rules summarized

Structure Pattern Role of Z Unconditional Conditioned on Z Action
Chain \(X \rightarrow Z \rightarrow Y\) Mediator Open Blocked Do NOT adjust (blocks causal path)
Fork \(X \leftarrow Z \rightarrow Y\) Confounder Open Blocked DO adjust (removes spurious path)
Collider \(X \rightarrow Z \leftarrow Y\) Collider Blocked Opened Do NOT adjust (opens spurious path)


Key takeaway: Chains and forks — condition to block. Colliders — condition to open. Every complex DAG reduces to combinations of these three structures.

d-Separation

Real DAGs have dozens of paths. We need an algorithm, not intuition.

d-separation checks every path between two nodes simultaneously

Definition: d-separation

Two nodes \(X\) and \(Y\) are d-separated by a set \(Z\) (written \(X \perp\!\!\!\perp_{G} Y \mid Z\)) if and only if every path between \(X\) and \(Y\) is blocked by \(Z\).

A path is blocked by \(Z\) if it contains at least one of:

(a) A chain \(\ldots \rightarrow W \rightarrow \ldots\) or fork \(\ldots \leftarrow W \rightarrow \ldots\) where \(W \in Z\)

(b) A collider \(\ldots \rightarrow W \leftarrow \ldots\) where \(W \notin Z\) and no descendant of \(W\) is in \(Z\)

If \(X\) and \(Y\) are not d-separated by \(Z\), they are d-connected given \(Z\) — at least one open path remains.


Algorithm: For each path between \(X\) and \(Y\), check every triple. If all paths are blocked, the nodes are d-separated. If any path is open, they are d-connected.

d-separation is a graphical test for conditional independence

Under the Local Markov and Faithfulness assumptions:

\[X \perp\!\!\!\perp_{G} Y \mid Z \quad \iff \quad X \perp\!\!\!\perp Y \mid Z\]

d-separation in the graph corresponds to conditional independence in the distribution.

Implications:

  • Markov direction (\(\Rightarrow\)): If \(X\) and \(Y\) are d-separated by \(Z\) in the graph, then \(X \perp\!\!\!\perp Y \mid Z\) in every distribution compatible with the DAG.

  • Faithfulness direction (\(\Leftarrow\)): If \(X \perp\!\!\!\perp Y \mid Z\) in the distribution, then \(X\) and \(Y\) are d-separated by \(Z\) in the graph. (No “accidental” cancellations.)

This correspondence is what makes DAGs useful for causal inference: graphical structure \(\leftrightarrow\) statistical testable predictions. Violations suggest the DAG is misspecified.

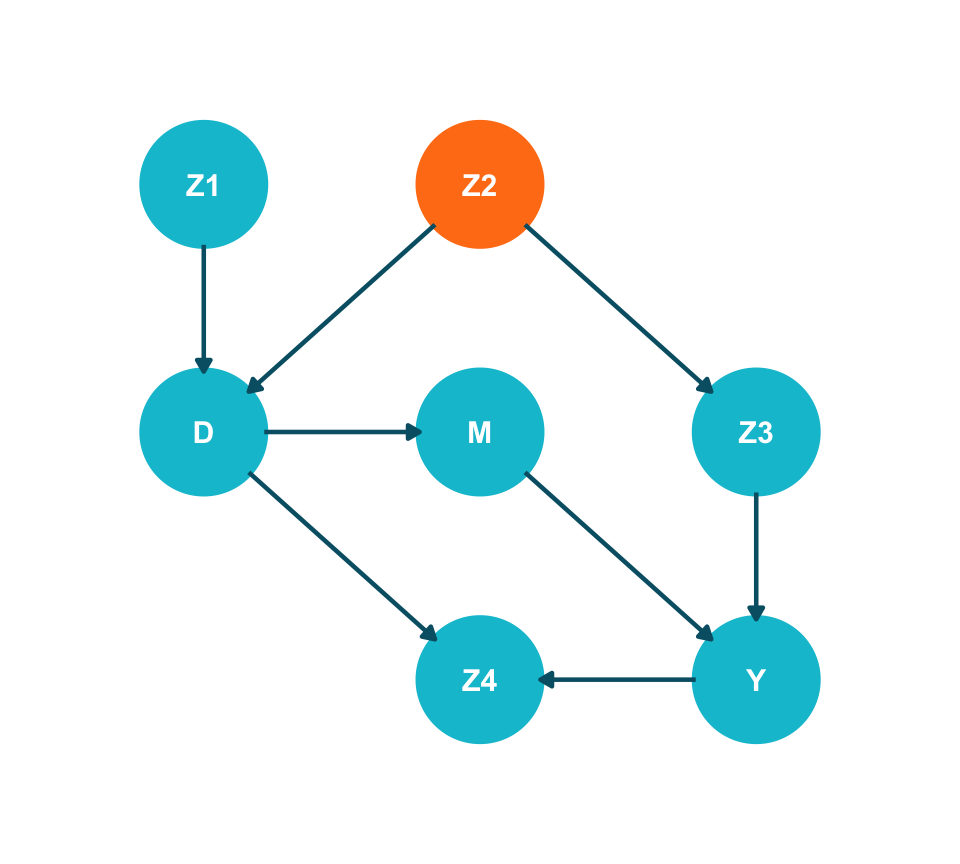
Worked example: Is \(D \perp\!\!\!\perp_{G} Y \mid \{Z2\}\)?

Show code
library(ggdag)
library(ggplot2)

coord_dag <- list(
  x = c(Z1 = 0, Z2 = 0.5, D = 0, Z3 = 1, M = 0.5, Y = 1, Z4 = 0.5),
  y = c(Z1 = 1, Z2 = 1, D = 0.5, Z3 = 0.5, M = 0.5, Y = 0, Z4 = 0)
)

dag <- dagify(
  D ~ Z1,
  D ~ Z2,
  Z3 ~ Z2,
  M ~ D,
  Y ~ M,
  Y ~ Z3,
  Z4 ~ D,
  Z4 ~ Y,
  coords = coord_dag
)

dag_data <- dag |> tidy_dagitty()
dag_data$data$colour <- ifelse(dag_data$data$name == "Z2",
                               "#FF7E15", "#00C1D4")

dag_data |>
  ggplot(aes(x = x, y = y, xend = xend, yend = yend)) +
  geom_dag_point(aes(colour = colour), size = 22) +
  scale_colour_identity() +
  geom_dag_edges(edge_colour = "#005e73", edge_width = 0.8) +
  geom_dag_text(colour = "white", size = 4, fontface = "bold") +
  expand_limits(x = c(-0.2, 1.2), y = c(-0.2, 1.2)) +
  coord_cartesian(clip = "off") +
  theme_dag(legend.position = "none")
Paths from \(D\) to \(Y\):

  1. \(D \rightarrow M \rightarrow Y\) (chain — open, no conditioned node)
  2. \(D \leftarrow Z2 \rightarrow Z3 \rightarrow Y\) (fork at Z2 — blocked by conditioning on Z2)
  3. \(D \rightarrow Z4 \leftarrow Y\) (collider at Z4 — blocked, Z4 not conditioned on)


Path 1 is open \(\Rightarrow\) d-connected. \(D \not\perp\!\!\!\perp_{G} Y \mid \{Z2\}\).

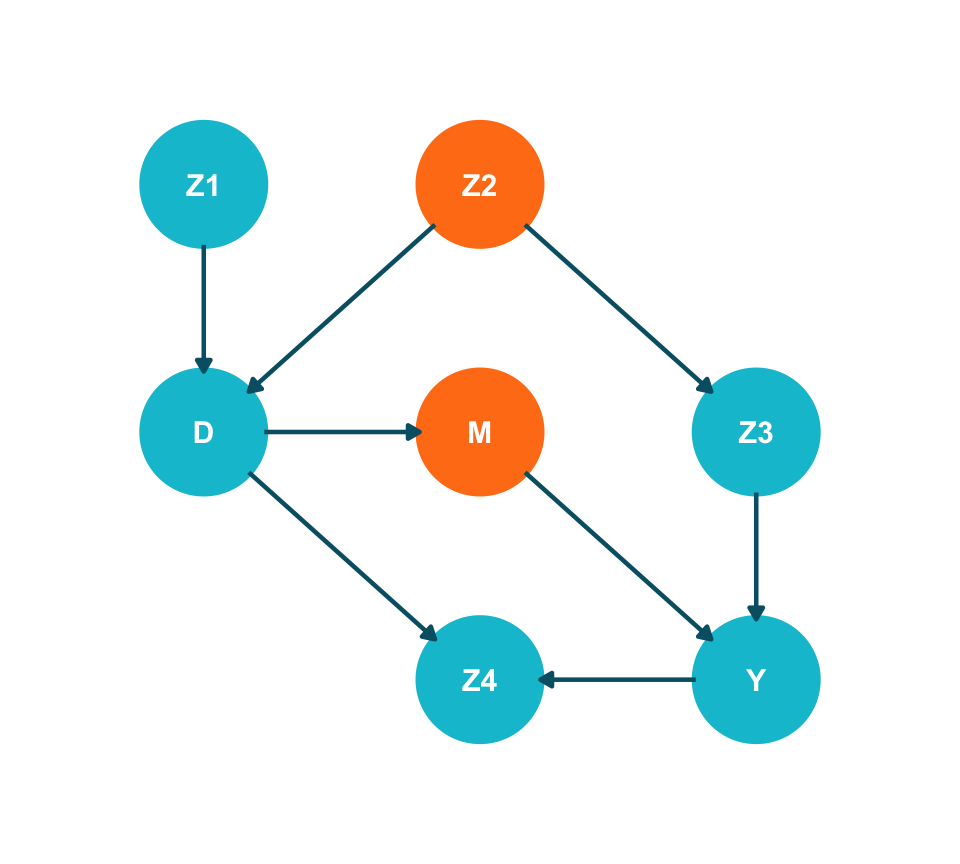
Worked example: Is \(D \perp\!\!\!\perp_{G} Y \mid \{Z2, M\}\)?

Show code
library(ggdag)
library(ggplot2)

coord_dag <- list(
  x = c(Z1 = 0, Z2 = 0.5, D = 0, Z3 = 1, M = 0.5, Y = 1, Z4 = 0.5),
  y = c(Z1 = 1, Z2 = 1, D = 0.5, Z3 = 0.5, M = 0.5, Y = 0, Z4 = 0)
)

dag <- dagify(
  D ~ Z1,
  D ~ Z2,
  Z3 ~ Z2,
  M ~ D,
  Y ~ M,
  Y ~ Z3,
  Z4 ~ D,
  Z4 ~ Y,
  coords = coord_dag
)

dag_data <- dag |> tidy_dagitty()
dag_data$data$colour <- ifelse(dag_data$data$name %in% c("Z2", "M"),
                               "#FF7E15", "#00C1D4")

dag_data |>
  ggplot(aes(x = x, y = y, xend = xend, yend = yend)) +
  geom_dag_point(aes(colour = colour), size = 22) +
  scale_colour_identity() +
  geom_dag_edges(edge_colour = "#005e73", edge_width = 0.8) +
  geom_dag_text(colour = "white", size = 4, fontface = "bold") +
  expand_limits(x = c(-0.2, 1.2), y = c(-0.2, 1.2)) +
  coord_cartesian(clip = "off") +
  theme_dag(legend.position = "none")
  1. \(D \rightarrow M \rightarrow Y\) — blocked (M conditioned on)
  2. \(D \leftarrow Z2 \rightarrow Z3 \rightarrow Y\) — blocked (Z2 conditioned on)
  3. \(D \rightarrow Z4 \leftarrow Y\) — blocked (collider, Z4 not conditioned on)


All paths blocked \(\Rightarrow\) d-separated. \(D \perp\!\!\!\perp_{G} Y \mid \{Z2, M\}\).

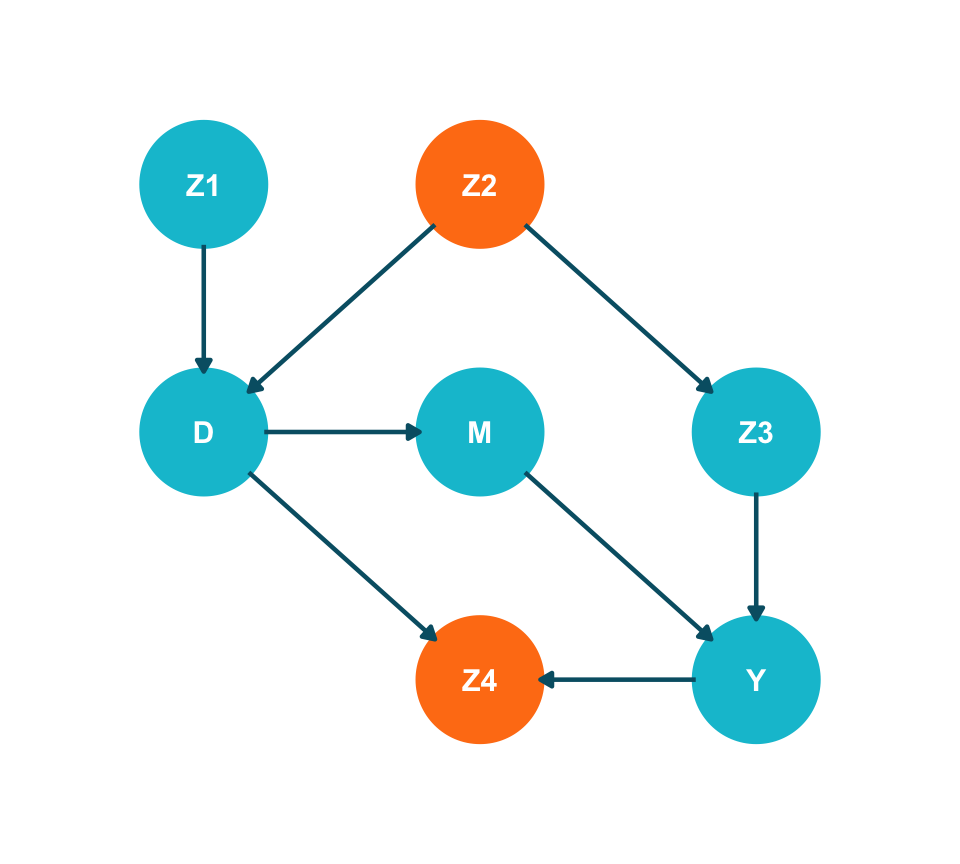
Worked example: Is \(D \perp\!\!\!\perp_{G} Y \mid \{Z2, Z4\}\)?

Show code
library(ggdag)
library(ggplot2)

coord_dag <- list(
  x = c(Z1 = 0, Z2 = 0.5, D = 0, Z3 = 1, M = 0.5, Y = 1, Z4 = 0.5),
  y = c(Z1 = 1, Z2 = 1, D = 0.5, Z3 = 0.5, M = 0.5, Y = 0, Z4 = 0)
)

dag <- dagify(
  D ~ Z1,
  D ~ Z2,
  Z3 ~ Z2,
  M ~ D,
  Y ~ M,
  Y ~ Z3,
  Z4 ~ D,
  Z4 ~ Y,
  coords = coord_dag
)

dag_data <- dag |> tidy_dagitty()
dag_data$data$colour <- ifelse(dag_data$data$name %in% c("Z2", "Z4"),
                               "#FF7E15", "#00C1D4")

dag_data |>
  ggplot(aes(x = x, y = y, xend = xend, yend = yend)) +
  geom_dag_point(aes(colour = colour), size = 22) +
  scale_colour_identity() +
  geom_dag_edges(edge_colour = "#005e73", edge_width = 0.8) +
  geom_dag_text(colour = "white", size = 4, fontface = "bold") +
  expand_limits(x = c(-0.2, 1.2), y = c(-0.2, 1.2)) +
  coord_cartesian(clip = "off") +
  theme_dag(legend.position = "none")
  1. \(D \rightarrow M \rightarrow Y\) — open (M not conditioned on)
  2. \(D \leftarrow Z2 \rightarrow Z3 \rightarrow Y\) — blocked (Z2 conditioned on)
  3. \(D \rightarrow Z4 \leftarrow Y\) — opened (collider Z4 conditioned on!)


d-connected via two open paths. Conditioning on Z4 made things worse.

Software verifies d-separation instantly

R: dagitty + ggdag   |   Python: pgmpy   |   Browser: dagitty.net

Show code
library(dagitty)

dag <- dagitty("dag{
  Z1 -> D
  Z2 -> D
  Z2 -> Z3
  D -> M -> Y
  Z3 -> Y
  D -> Z4
  Y -> Z4
}")

cat("D _||_ Y | {Z2}?       ", dseparated(dag, "D", "Y", "Z2"), "\n")
D _||_ Y | {Z2}?        FALSE 
Show code
cat("D _||_ Y | {Z2, M}?    ", dseparated(dag, "D", "Y", c("Z2", "M")), "\n")
D _||_ Y | {Z2, M}?     TRUE 
Show code
cat("D _||_ Y | {Z2, Z4}?   ", dseparated(dag, "D", "Y", c("Z2", "Z4")), "\n")
D _||_ Y | {Z2, Z4}?    FALSE 
Show code
from pgmpy.base import DAG

dag = DAG([
    ("Z1", "D"), ("Z2", "D"), ("Z2", "Z3"),
    ("D", "M"), ("M", "Y"), ("Z3", "Y"),
    ("D", "Z4"), ("Y", "Z4")
])

print("D ⊥ Y | {Z2}?      ",
      not dag.is_dconnected("D", "Y", observed=["Z2"]))
D ⊥ Y | {Z2}?       False
Show code
print("D ⊥ Y | {Z2, M}?   ",
      not dag.is_dconnected("D", "Y", observed=["Z2", "M"]))
D ⊥ Y | {Z2, M}?    True
Show code
print("D ⊥ Y | {Z2, Z4}?  ",
      not dag.is_dconnected("D", "Y", observed=["Z2", "Z4"]))
D ⊥ Y | {Z2, Z4}?   False

Flow of association and causation — the big picture

  • Total association between two variables flows along all unblocked paths in a DAG.
    • Association along directed unblocked paths is causal — asymmetric, a subset of total association.
    • The rest is non-causal: confounding or selection bias — symmetric, not the target of inference.
  • d-separation lets us ask: “Ignoring the causal paths, are \(X\) and \(Y\) d-separated otherwise?” If yes, observed association equals causal effect.

The do-Operator

Before identifying causal effects, we need to be precise about what an intervention is.

Conditioning vs. intervention: two different distributions

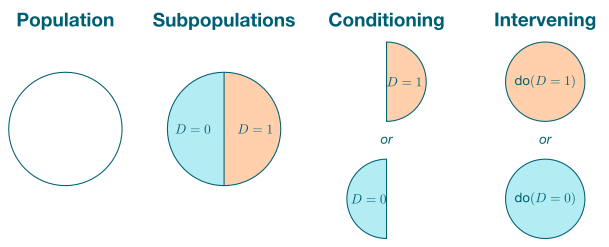
  • Conditioning filters the data: keep only units with \(D = d\) (a half-population). Their covariate distribution \(P(X \mid D = d)\) is generally not the population’s — it is contaminated by whatever pushed those units toward \(D = d\).
  • Intervention sets \(D = d\) for everyone (the full population): the rest of the system (in particular \(P(X)\)) is left intact. Graphically, the arrow \(X \rightarrow D\) is severed.
  • The two distributions coincide only in special cases: no confounding (no \(X \rightarrow D\) to begin with), an RCT (randomization breaks \(X \rightarrow D\) by design), or a satisfied identification criterion (we reconstruct the interventional distribution from observation + adjustment).

Adapted from Neal, B. (2020). Introduction to Causal Inference from a Machine Learning Perspective.

Graph surgery shows what intervention really means

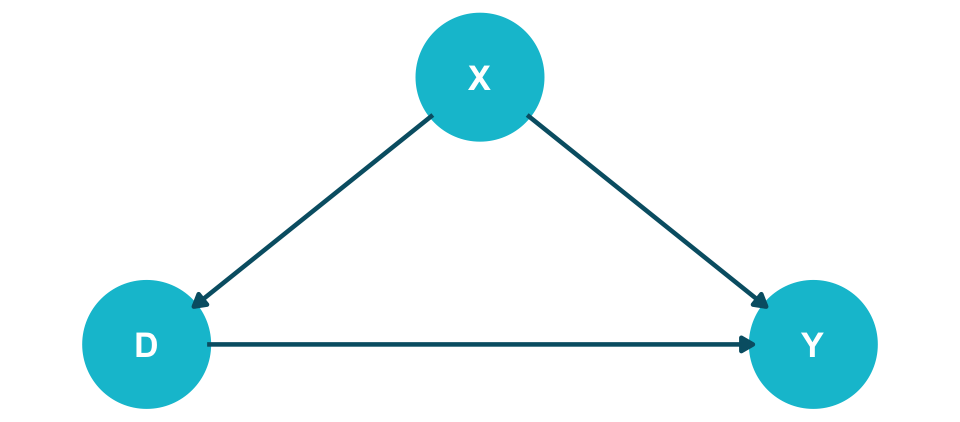
Observational graph \(G\):

When we simply observe \(D\), all arrows remain. \(D\) is determined by its causes (including confounders).

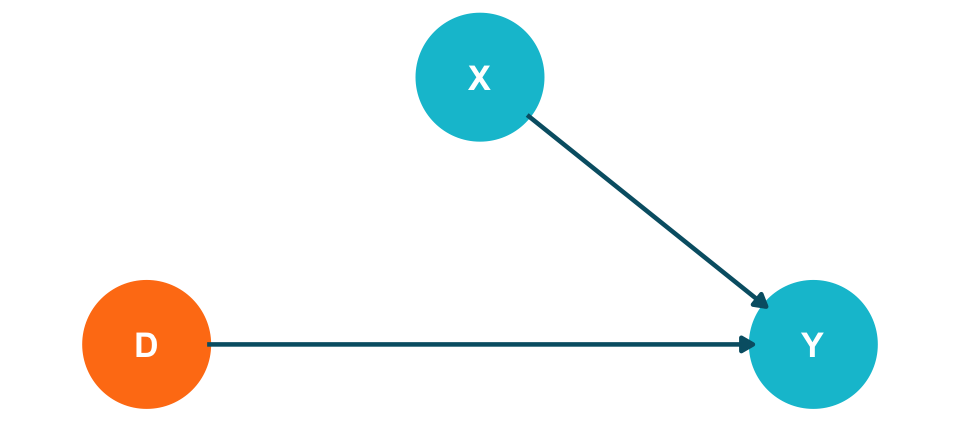
Mutilated graph \(G_{\overline{D}}\):

When we intervene on \(D\) (set \(D = d\)), we delete all arrows into \(D\). The intervention replaces whatever normally determines \(D\).

The do-operator is concrete: \(P(Y \mid do(D = d))\) is simply \(P(Y \mid D = d)\) in the mutilated graph \(G_{\overline{D}}\). Graph surgery severs the confounding, making \(D\) independent of \(X\). This is exactly what an RCT does in practice.

Many (if not most) real questions involve intervention, not prediction: \(P(\text{Performance} \mid do(\text{Training}))\), \(\;P(\text{Sales} \mid do(\text{Incentive}))\), \(\;P(\text{CTR} \mid do(\text{Ad}))\), \(\;P(\text{Churn} \mid do(\text{Call center}))\).

Why conditioning ≠ intervention: factorizations differ

Observational (graph \(G\), all arrows intact):

\[P(X, D, Y) = P(X)\,\underbrace{P(D \mid X)}_{\text{cause of } D}\,P(Y \mid D, X)\]

Step 1 — Bayes for the weight on \(x\): \[\textcolor{#00C1D4}{P(X \mid D = d)} = \frac{P(X)\,P(D = d \mid X)}{P(D = d)}\]

Step 2 — chain rule for \((X, Y)\) given \(D = d\): \[P(X, Y \mid D = d) = P(Y \mid D = d, X)\,\textcolor{#00C1D4}{P(X \mid D = d)}\]

Step 3 — sum over \(x\) (law of total probability): \[P(Y \mid D = d) = \sum_x P(Y \mid D = d, X = x)\,\underbrace{\textcolor{#00C1D4}{P(X \mid D = d)}}_{\text{post-treatment weight}}\]

Interventional (graph \(G_{\overline{D}}\), \(do(D = d)\) deletes \(P(D \mid X)\)):

\[P(X, D, Y) = P(X)\,\cancel{P(D \mid X)}\,P(Y \mid D, X)\]

Step 1 — under intervention, \(X\) is unaffected: \[P(X \mid do(D = d)) = \textcolor{#FF7E15}{P(X)}\]

Step 2 — truncated joint of \((X, Y)\) at \(D = d\): \[P(X, Y \mid do(D = d)) = P(Y \mid D = d, X)\,\textcolor{#FF7E15}{P(X)}\]

Step 3 — sum over \(x\): \[P(Y \mid do(D = d)) = \sum_x P(Y \mid D = d, X = x)\,\underbrace{\textcolor{#FF7E15}{P(X)}}_{\text{natural weight}}\]

Same kernel \(P(Y \mid D = d, X)\) — only the weight on \(x\) differs: \(\textcolor{#00C1D4}{P(X \mid D = d)}\) vs. \(\textcolor{#FF7E15}{P(X)}\), equal iff \(X \perp\!\!\!\perp D\).

References

Elwert, Felix. 2013. “Graphical Causal Models.” In Handbook of Causal Analysis for Social Research, edited by Stephen L. Morgan, 245–73. Springer. https://doi.org/10.1007/978-94-007-6094-3_13.
Pearl, Judea. 2009. Causality: Models, Reasoning, and Inference. 2nd ed. Cambridge University Press. https://doi.org/10.1017/CBO9780511803161.
Thank you for your attention!