1. Introduction to Causal Inference

Causal Data Science for Business Analytics

Christoph Ihl

Hamburg University of Technology

Monday, 13. April 2026

Motivation

Causality is the language of decisions

“I would rather discover one causal law than be King of Persia.” — Democritus (c. 460–370 BC)

“We do not have knowledge of a thing until we have grasped its cause.” — Aristotle, Physics II.3


  • Classical statistics answers: “How are X and Y associated?”
  • Machine learning answers: “Given X, what is the best prediction of Y?”
  • Neither answers: “What happens to Y if we do X?”

Nobel Prize quote on causal knowledge

Yet statistics is crucial for understanding causality — it provides the formal language and estimation methods to quantify causal effects from data.

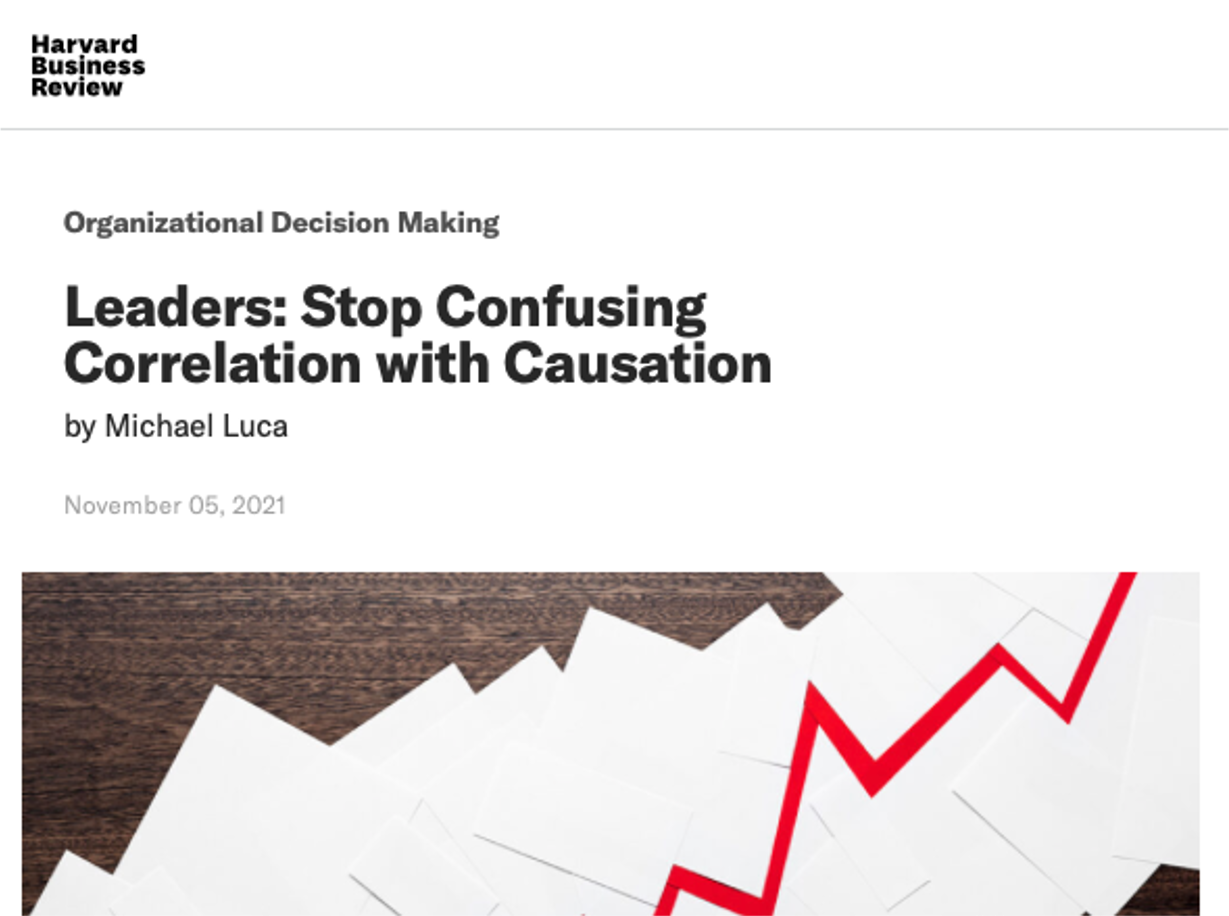
Leaders routinely confuse correlation with causation

Harvard Business Review article on correlation vs. causation

Luca (2021)

Practitioner Evidence

Hünermund, Kaminski, and Schmitt (2022): Of 234 business practitioners surveyed, the vast majority use machine learning for decision problems that require causal, not correlational, answers — yet few apply causal methods.

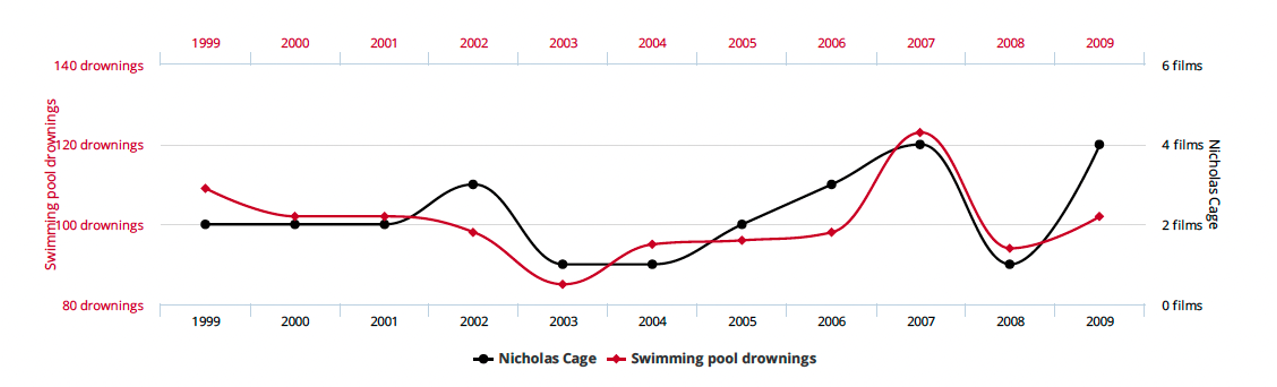
Spurious correlations look convincing until you see the mechanism

Spurious correlation: Nicolas Cage films vs. swimming pool drownings

Nicolas Cage films vs. swimming pool drownings. Source: Tyler Vigen, Spurious Correlations

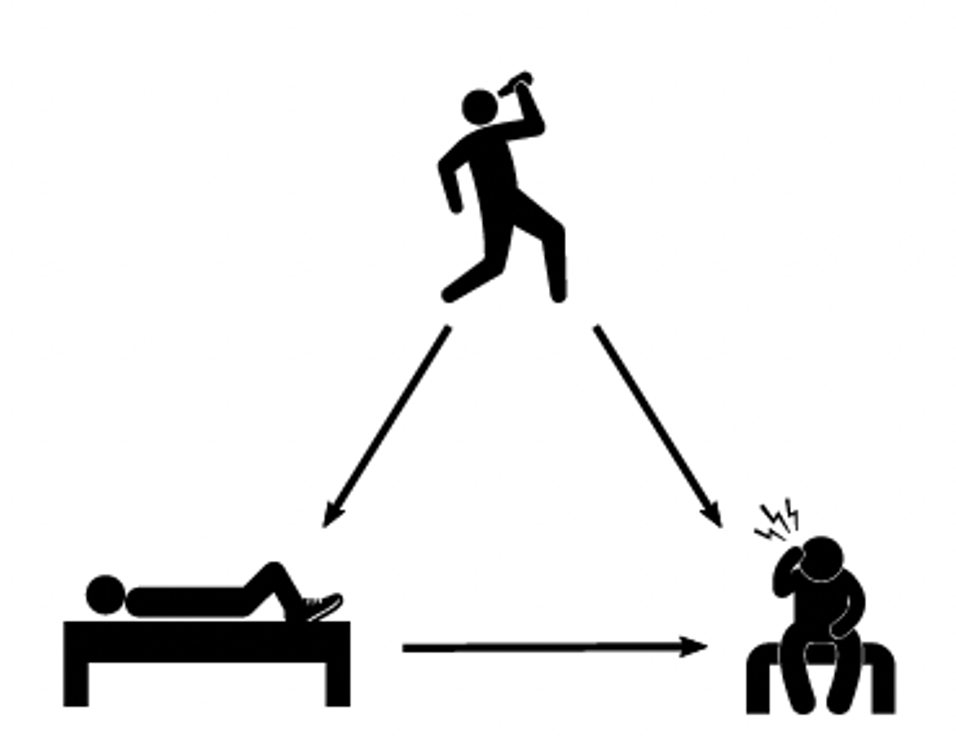
A common cause creates spurious association

The word for this is confounder: a common cause that creates a non-causal association between two variables.

Example: Drinking the night before is a common cause of both sleeping with shoes on and waking up with a headache. Shoes do not cause headaches.

Confounding DAG: drinking causes both sleeping with shoes on and headache

Neal (2020)

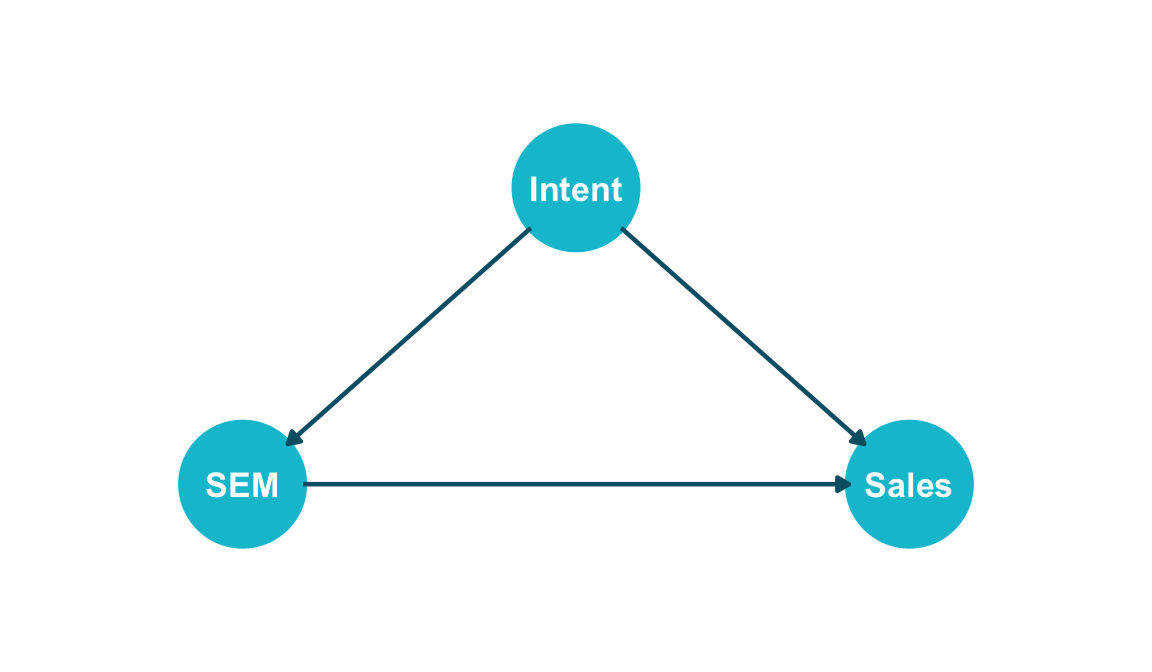
Even credible business data can mislead without causal reasoning

Blake, Nosko, and Tadelis (2015): eBay ran a large-scale experiment on branded search engine marketing (SEM) ads. They found that most of the “revenue” attributed to SEM was from consumers who would have purchased anyway. Consumers’ purchase intent is a common cause of both SEM ad clicks and sales.

Show code
library(ggdag)
library(ggplot2)

coord_dag <- list(
  x = c(SEM = 0, Intent = 0.5, Sales = 1),
  y = c(SEM = 0, Intent = 0.5, Sales = 0)
)

dag <- dagify(SEM ~ Intent,
              Sales ~ SEM,
              Sales ~ Intent,
              coords = coord_dag)

dag |>
  ggplot(aes(x = x, y = y, xend = xend, yend = yend)) +
  geom_dag_point(colour = "#00C1D4", size = 22) +
  geom_dag_edges(edge_colour = "#005e73", edge_width = 0.8) +
  geom_dag_text(colour = "white", size = 4.5, fontface = "bold") +
  expand_limits(x = c(-0.2, 1.2), y = c(-0.2, 0.7)) +
  coord_cartesian(clip = "off") +
  theme_dag(legend.position = "none")

Blake, Nosko, and Tadelis (2015)

Simpson’s Paradox

Google found it was underpaying… men?

“When Google conducted a pay study, it found it was underpaying men for similar work. The company […] increased compensation for thousands of male employees.” — The New York Times, March 2019


But wait — wasn’t Google just recently accused of discriminating against women?

“The US Department of Labor claims Google has systematically underpaid its female employees.” — The Verge, April 2017


How can the same company underpay both men and women? The answer lies in Simpson’s Paradox.

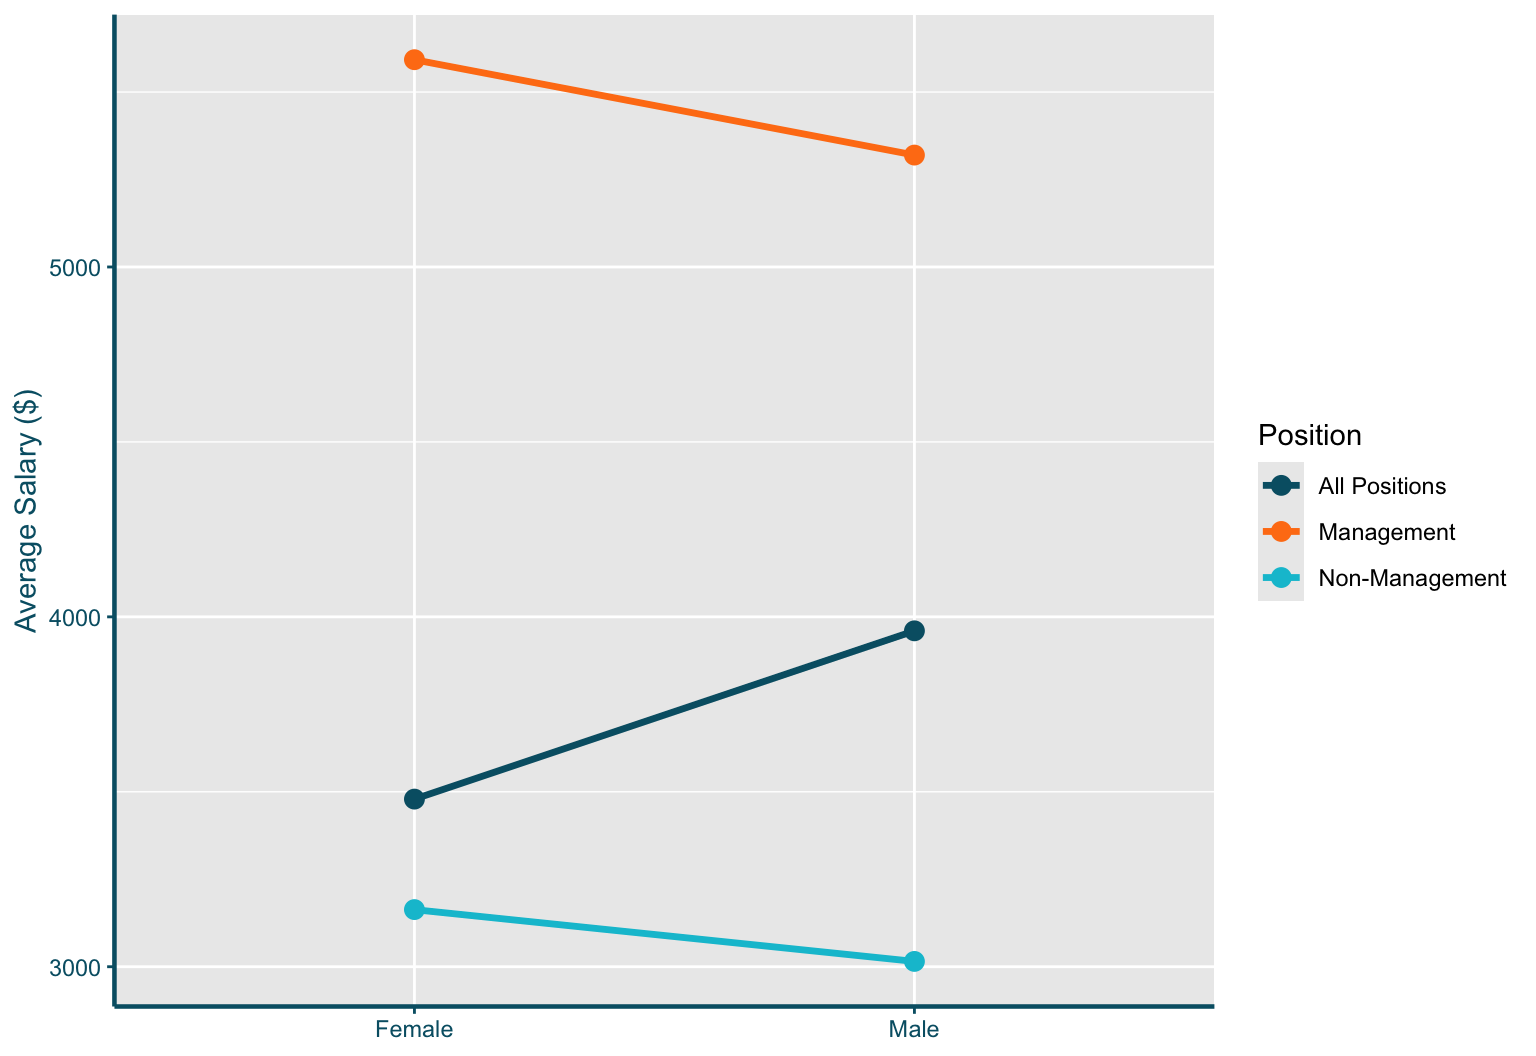
The same data, two opposite conclusions

Consider a simplified company with 100 women and 100 men:

Women Men
Non-Management $3,163.30   (87 employees) $3,015.18   (59 employees)
Management $5,592.44   (13 employees) $5,319.82   (41 employees)

Unadjusted gap (ignoring position):

\[\underbrace{\tfrac{87}{100} \times 3{,}163.30 + \tfrac{13}{100} \times 5{,}592.44}_{Women: \$3{,}479.09} \;-\; \underbrace{\tfrac{59}{100} \times 3{,}015.18 + \tfrac{41}{100} \times 5{,}319.82}_{Men: \$3{,}960.08} \;\approx\; -\$481\]

Adjusted gap — within each position, women earn more:

\[\underbrace{\tfrac{146}{200} \times (3{,}163.30 - 3{,}015.18)}_{\text{Non-Mgmt: } +\$108.13} \;+\; \underbrace{\tfrac{54}{200} \times (5{,}592.44 - 5{,}319.82)}_{\text{Mgmt: } +\$73.61} \;\approx\; +\$181.74\]

Which estimate gives us a more accurate picture?

The answer depends on causal structure, not statistics

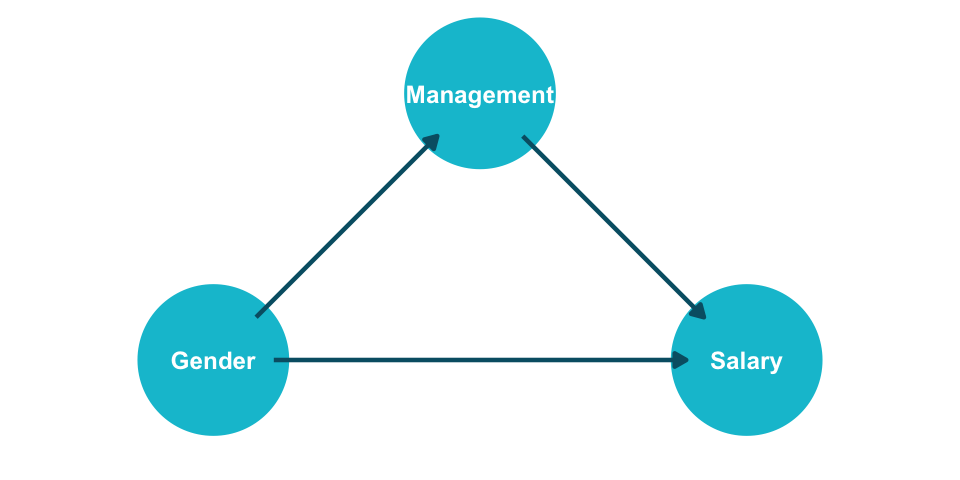
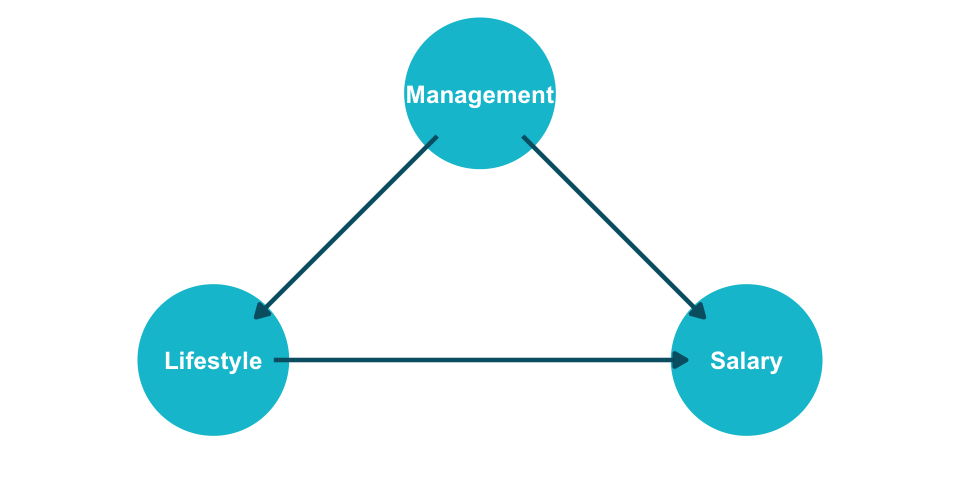
The same numbers could describe a completely different scenario. Replace “Gender” with “Lifestyle” and “Position” with “Management” — the joint distribution is identical.

Scenario 1: Gender → Position → Salary

Position is a mediator — do NOT adjust.

Show code
library(ggdag)
library(ggplot2)

coord_dag <- list(
  x = c(Gender = 0, Management = 0.5, Salary = 1),
  y = c(Gender = 0, Management = 0.5, Salary = 0)
)
dag <- dagify(Management ~ Gender,
              Salary ~ Gender,
              Salary ~ Management,
              coords = coord_dag)
dag |>
  ggplot(aes(x = x, y = y, xend = xend, yend = yend)) +
  geom_dag_point(colour = "#00C1D4", size = 26) +
  geom_dag_edges(edge_colour = "#005e73", edge_width = 0.8) +
  geom_dag_text(colour = "white", size = 3.2, fontface = "bold") +
  expand_limits(x = c(-0.25, 1.25), y = c(-0.15, 0.6)) +
  coord_cartesian(clip = "off") +
  theme_dag(legend.position = "none") +
  theme(plot.margin = margin(0, 0, 0, 0))

Scenario 2: Management → Lifestyle → Salary

Management is a confounder — DO adjust.

Show code
library(ggdag)
library(ggplot2)

coord_dag <- list(
  x = c(Lifestyle = 0, Management = 0.5, Salary = 1),
  y = c(Lifestyle = 0, Management = 0.5, Salary = 0)
)
dag <- dagify(Lifestyle ~ Management,
              Salary ~ Lifestyle,
              Salary ~ Management,
              coords = coord_dag)
dag |>
  ggplot(aes(x = x, y = y, xend = xend, yend = yend)) +
  geom_dag_point(colour = "#00C1D4", size = 26) +
  geom_dag_edges(edge_colour = "#005e73", edge_width = 0.8) +
  geom_dag_text(colour = "white", size = 3.2, fontface = "bold") +
  expand_limits(x = c(-0.25, 1.25), y = c(-0.15, 0.6)) +
  coord_cartesian(clip = "off") +
  theme_dag(legend.position = "none") +
  theme(plot.margin = margin(0, 0, 0, 0))

The joint distribution is identical. Statistics alone cannot tell you which analysis is correct.

Statistics without causal assumptions is incomplete

1. Simpson’s Paradox: subgroup and aggregate trends can reverse — this is not a quirk but a structural feature of confounded data.


2. Whether to condition on a variable depends on its causal role (mediator vs. confounder) — not its statistical properties.


3. Causal assumptions are required for any analysis that goes beyond mere description. Statistics tells us what; causal inference tells us why and what if.


Transition: The potential outcomes framework gives us the formal language to state these assumptions precisely.

Potential Outcomes

Causation requires a well-defined intervention

“No causation without manipulation.” — Rubin (1978); Holland (1986)


Treatments can be binary, multi-valued, or continuous:

  • Take a drug vs. don’t take the drug
  • Training program A vs. B vs. no training
  • Amount of money spent on advertising (continuous)
  • Race listed on a resume (Bertrand and Mullainathan 2004) — what counts as a “manipulation”?
  • A person’s level of neuroticism? (Boundary case — hard to define an intervention)


The potential outcomes framework (Neyman 1990; Rubin 1974) formalizes causal questions by defining what would have happened under each possible treatment.

Formal notation: units, treatments, and potential outcomes

  • \(n\) units indexed by \(i = 1, \ldots, n\)
  • \(Y\): outcome of interest
  • \(D_i\): treatment assignment for unit \(i\) (binary: \(d_i \in \{0, 1\}\))


Potential outcomes:

  • \(Y_i(1)\): the outcome unit \(i\) would experience if treated (\(D_i = 1\))
  • \(Y_i(0)\): the outcome unit \(i\) would experience if not treated (\(D_i = 0\))


Individual Treatment Effect (ITE):

\[\tau_i = Y_i(1) - Y_i(0) \quad \forall \; i = 1, \ldots, n\]


Each unit has a pair of potential outcomes. The ITE compares them. The notation forces us to think about both possible states of the world.

SUTVA makes potential outcomes well-defined

For the potential outcomes \(Y_i(0)\) and \(Y_i(1)\) to be well-defined, we need:

Assumption 1: No Interference

Unit \(i\)’s potential outcomes do not depend on any other unit’s treatment assignment:

\[Y_i(d_1, d_2, \ldots, d_n) = Y_i(d_i)\]

Violated when: vaccination reduces disease for unvaccinated neighbors; a price change for one customer affects others’ behavior.

Assumption 2: Consistency (No Hidden Treatment Versions)

The observed outcome equals the potential outcome for the treatment actually received:

\[\text{If } D_i = d, \text{ then } Y_i = Y_i(d)\]

Violated when: “treatment” is ambiguous — e.g., “taking aspirin” could mean different doses, brands, or timing.

Assumption 3: SUTVA (Stable Unit Treatment Value Assumption)

Both Assumptions 1 and 2 hold: \(Y_i = Y_i(D_i)\). Under SUTVA, each unit has exactly two well-defined potential outcomes.

We never observe both potential outcomes for the same unit

Switching equation: \(\; Y_i = D_i \cdot Y_i(1) + (1 - D_i) \cdot Y_i(0)\)

We observe only the potential outcome corresponding to the treatment actually received.

\(i\) \(D_i\) \(Y_i\) \(Y_i(1)\) \(Y_i(0)\) \(Y_i(1) - Y_i(0)\)
1 0 0 ? 0 ?
2 1 1 1 ? ?
3 1 0 0 ? ?
4 0 0 ? 0 ?
5 0 1 ? 1 ?
6 1 1 1 ? ?

This is the Fundamental Problem of Causal Inference (Holland 1986): every individual treatment effect \(\tau_i\) requires a quantity we can never measure.

Can we salvage the situation by averaging?

Average Treatment Effect (ATE):

\[\tau = \mathbb{E}[\tau_i] = \mathbb{E}[Y_i(1) - Y_i(0)] = \mathbb{E}[Y_i(1)] - \mathbb{E}[Y_i(0)]\]

Or equivalently in finite-sample notation:

\[\tau = \frac{1}{n} \sum_{i=1}^{n} Y_i(1) \;-\; \frac{1}{n} \sum_{i=1}^{n} Y_i(0)\]


Still not computable — each sum requires all \(n\) values of \(Y(1)\) and all \(n\) values of \(Y(0)\), but we only observe one potential outcome per unit.

The counterfactuals are still missing. We need additional assumptions to make progress.

Under what assumptions can we identify causal effects from data?

Identification

Ignorability: treatment assignment is as good as random

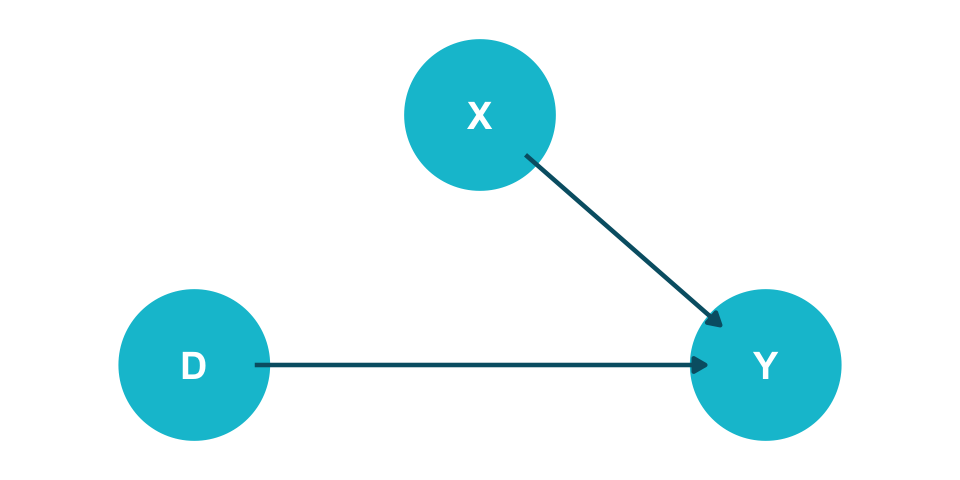
Assumption 4: Ignorability / Exchangeability / Unconfoundedness

\[(Y(1), Y(0)) \perp\!\!\!\perp D\]

The potential outcomes are statistically independent of treatment assignment. Intuitively: units in the treatment and control groups could be swapped without changing the outcome distributions.

Show code
library(ggdag)
library(ggplot2)

coord_dag <- list(
  x = c(D = 0, X = 0.5, Y = 1),
  y = c(D = 0, X = 0.5, Y = 0)
)
dag <- dagify(Y ~ D,
              Y ~ X,
              coords = coord_dag)
dag |>
  ggplot(aes(x = x, y = y, xend = xend, yend = yend)) +
  geom_dag_point(colour = "#00C1D4", size = 26) +
  geom_dag_edges(edge_colour = "#005e73", edge_width = 0.8) +
  geom_dag_text(colour = "white", size = 5, fontface = "bold") +
  expand_limits(x = c(-0.2, 1.2), y = c(-0.15, 0.65)) +
  coord_cartesian(clip = "off") +
  theme_dag(legend.position = "none") +
  theme(plot.margin = margin(0, 0, 0, 0))

Under exchangeability, observed means identify causal effects

Using Assumptions 4 (exchangeability) and 2 (consistency):

\[\mathbb{E}[Y_i(1)] - \mathbb{E}[Y_i(0)] = \mathbb{E}[Y_i \mid D_i = 1] - \mathbb{E}[Y_i \mid D_i = 0]\]

The causal estimand (left) equals an associational estimand (right) that is computable from data.

\(i\) \(D_i\) \(Y_i\) \(Y_i(1)\) \(Y_i(0)\)
1 0 0 ? 0
4 0 0 ? 0
5 0 1 ? 1
2 1 1 1 ?
3 1 0 0 ?
6 1 1 1 ?

\(\hat{\mathbb{E}}[Y \mid D=1] = \frac{1+0+1}{3} = 0.67\), \(\quad \hat{\mathbb{E}}[Y \mid D=0] = \frac{0+0+1}{3} = 0.33\), \(\quad \widehat{ATE} = 0.33\)


Identification flowchart: Causal Estimand to Statistical Estimand to Estimate

Identification workflow: Causal Estimand → Statistical Estimand → Estimate.

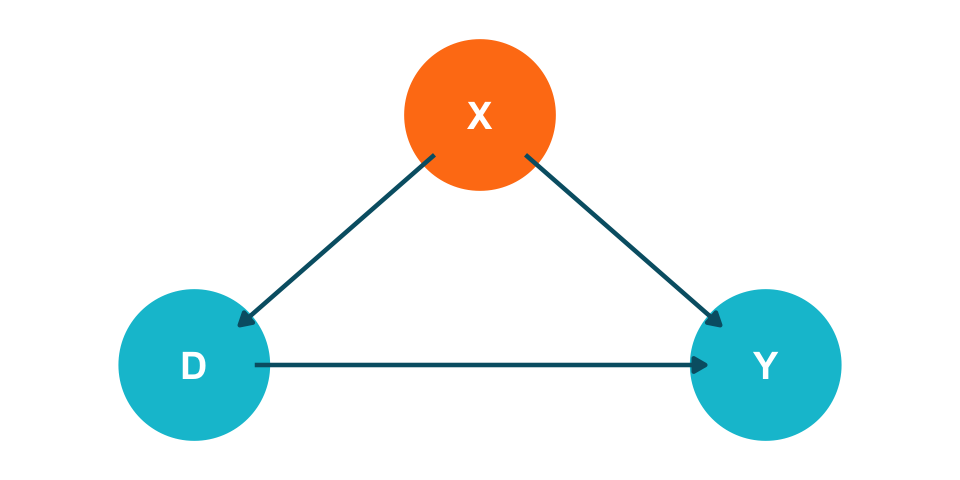
Conditional exchangeability makes ignorability realistic

Assumption 5: Conditional Ignorability / Conditional Exchangeability / Unconfoundedness

\[(Y(1), Y(0)) \perp\!\!\!\perp D \mid X\]

Potential outcomes are independent of treatment, conditional on observed covariates \(X\). Within strata defined by \(X\), treatment assignment is as good as random.

Show code
library(ggdag)
library(ggplot2)

coord_dag <- list(
  x = c(D = 0, X = 0.5, Y = 1),
  y = c(D = 0, X = 0.5, Y = 0)
)
dag <- dagify(Y ~ D,
              Y ~ X,
              D ~ X,
              coords = coord_dag)

dag_data <- dag |> tidy_dagitty()
dag_data$data$colour <- ifelse(dag_data$data$name == "X", "#FF7E15", "#00C1D4")

dag_data |>
  ggplot(aes(x = x, y = y, xend = xend, yend = yend)) +
  geom_dag_point(aes(colour = colour), size = 26) +
  scale_colour_identity() +
  geom_dag_edges(edge_colour = "#005e73", edge_width = 0.8) +
  geom_dag_text(colour = "white", size = 5, fontface = "bold") +
  expand_limits(x = c(-0.2, 1.2), y = c(-0.15, 0.65)) +
  coord_cartesian(clip = "off") +
  theme_dag(legend.position = "none") +
  theme(plot.margin = margin(0, 0, 0, 0))

Positivity ensures we can estimate both counterfactuals

Assumption 6: Positivity / Overlap / Common Support

\[0 < P(D = 1 \mid X = x) < 1 \quad \text{for all } x \text{ with } P(X = x) > 0\]

Every subgroup defined by \(X\) must contain both treated and untreated units.


Trade-off: conditioning on more covariates helps unconfoundedness but can hurt positivity — adding variables to \(X\) increases the risk of empty strata.

The ATE is identified under four assumptions

Theorem: Identification of the ATE

Under conditional unconfoundedness, positivity, consistency, and no interference:

\[\tau = \mathbb{E}_X\!\Big[\mathbb{E}[Y_i \mid D_i = 1, X_i] - \mathbb{E}[Y_i \mid D_i = 0, X_i]\Big]\]

The outer expectation \(\mathbb{E}_X\) averages the conditional treatment effects over the distribution of \(X\) in the population. This is the adjustment formula — the foundation for regression, matching, IPW, and double ML.


Required assumptions:

  1. Conditional unconfoundedness (Assumption 5): \((Y(1), Y(0)) \perp\!\!\!\perp D \mid X\)
  2. Positivity (Assumption 6): \(0 < P(D=1 \mid X=x) < 1\) for all relevant \(x\)
  3. Consistency (Assumption 2): \(D_i = d \Rightarrow Y_i = Y_i(d)\)
  4. No interference (Assumption 1): \(Y_i(d_1, \ldots, d_n) = Y_i(d_i)\)

From potential outcomes to observable data in four steps

\[ \begin{align*} \tau = \mathbb{E}[\tau_i] &= \mathbb{E}[Y_i(1) - Y_i(0)] \\ &= \mathbb{E}[Y_i(1)] - \mathbb{E}[Y_i(0)] \\ & \color{#00C1D4}{\text{(linearity of expectation)}} \\ &= \mathbb{E}_X [\mathbb{E}[Y_i(1) \mid X_i]] - \mathbb{E}_X [\mathbb{E}[Y_i(0) \mid X_i]] \\ &\color{#00C1D4}{\text{(law of iterated expectations)}} \\ &= \mathbb{E}_X [\mathbb{E}[Y_i(1) \mid D_i = 1, X_i]] - \mathbb{E}_X [\mathbb{E}[Y_i(0) \mid D_i = 0, X_i]] \\ &\color{#00C1D4}{\text{(unconfoundedness and positivity)}} \\ &= \mathbb{E}_X [\mathbb{E}[Y_i \mid D_i = 1, X_i]] - \mathbb{E}_X [\mathbb{E}[Y_i \mid D_i = 0, X_i]] \\ &\color{#00C1D4}{\text{(consistency)}} \end{align*} \]

Each step uses exactly one assumption. The final line contains only observable quantities.

Now we know what to estimate — but which quantity matters for your decision?

Estimands

The ATT asks what treatment did for those who received it

Average Treatment Effect on the Treated (ATT)

\[ATT = \mathbb{E}[Y_i(1) \mid D_i = 1] - \mathbb{E}[Y_i(0) \mid D_i = 1]\]

Business example: A company ran a loyalty program. The ATT answers: how much did the program benefit enrolled customers? The counterfactual is what they would have spent without the program.

Average Treatment Effect on the Control (ATC)

\[ATC = \mathbb{E}[Y_i(1) \mid D_i = 0] - \mathbb{E}[Y_i(0) \mid D_i = 0]\]

Decomposition: The ATE is a weighted average of ATT and ATC:

\[ATE = P(D=1) \cdot ATT + P(D=0) \cdot ATC\]

When \(ATT \neq ATC\), we have treatment effect heterogeneity by treatment status — those who select into treatment may benefit differently.

Treatment effects vary — CATE reveals who benefits most

Conditional Average Treatment Effect (CATE)

\[CATE(x) = \mathbb{E}[Y_i(1) \mid X_i = x] - \mathbb{E}[Y_i(0) \mid X_i = x]\]

The treatment effect for the subpopulation with covariates \(X = x\).


Business example: A new drug has a positive ATE on average. But which patients benefit most? CATE estimation reveals treatment effect heterogeneity across patient characteristics.

Industry application: Feuerriegel, Shrestha, and Krogh (2025) report that ABB Hitachi used CATE-based targeting to allocate quality interventions in manufacturing — cutting yield loss by half compared to a uniform treatment rule.


Course preview: Treatment effect heterogeneity is the focus of Sessions 08–09, where we cover Double Machine Learning and Causal Forests for flexible CATE estimation.

Key Takeaways

1. Causal questions require causal assumptions — statistics alone is not enough. Simpson’s Paradox shows that the same data supports opposite conclusions depending on causal structure.


2. The potential outcomes framework formalizes causality as a missing data problem. Each unit has two potential outcomes; we observe only one. Individual treatment effects are fundamentally unidentifiable.


3. Under ignorability + positivity + consistency, causal effects become identifiable from observational data. The adjustment formula translates causal estimands into statistical estimands that we can estimate.


Next session: We formalize causal assumptions using Directed Acyclic Graphs (DAGs) — a visual language for encoding what we believe about the data-generating process.

References

Bertrand, Marianne, and Sendhil Mullainathan. 2004. “Are Emily and Greg More Employable Than Lakisha and Jamal? A Field Experiment on Labor Market Discrimination.” American Economic Review 94 (4): 991–1013. https://doi.org/10.1257/0002828042002561.
Blake, Thomas, Chris Nosko, and Steven Tadelis. 2015. “Consumer Heterogeneity and Paid Search Effectiveness: A Large-Scale Field Experiment.” Econometrica 83 (1): 155–74. https://doi.org/10.3982/ECTA12423.
Feuerriegel, Stefan, Yash Raj Shrestha, and Georg von Krogh. 2025. “A New Machine Learning Approach Answers What-If Questions.” MIT Sloan Management Review 66 (3): 65–69. https://sloanreview.mit.edu/article/a-new-machine-learning-approach-answers-what-if-questions/.
Holland, Paul W. 1986. “Statistics and Causal Inference.” Journal of the American Statistical Association 81 (396): 945–60. https://doi.org/10.1080/01621459.1986.10478354.
Hünermund, Paul, Jermain Kaminski, and Carla Schmitt. 2022. “Causal Machine Learning and Business Decision Making.” SSRN Working Paper. https://doi.org/10.2139/ssrn.3867326.
Luca, Michael. 2021. “Leaders: Stop Confusing Correlation with Causation.” Harvard Business Review. https://hbr.org/2021/11/leaders-stop-confusing-correlation-with-causation.
Neal, Brady. 2020. Introduction to Causal Inference from a Machine Learning Perspective. Course Lecture Notes (draft). https://www.bradyneal.com/causal-inference-course.
Neyman, Jerzy. 1990. “On the Application of Probability Theory to Agricultural Experiments. Essay on Principles. Section 9.” Statistical Science 5 (4): 465–72. https://doi.org/10.1214/ss/1177012031.
Rubin, Donald B. 1974. “Estimating Causal Effects of Treatments in Randomized and Nonrandomized Studies.” Journal of Educational Psychology 66 (5): 688–701. https://doi.org/10.1037/h0037350.
———. 1978. “Bayesian Inference for Causal Effects: The Role of Randomization.” The Annals of Statistics 6 (1): 34–58. https://www.jstor.org/stable/2958688.
Thank you for your attention!